SmartfinancialInc SMBK full analysis,charts,indicators,moving averages,SMA,DMA,EMA,ADX,MACD,RSISmartfinancial Inc SMBK WideScreen charts, DMA,SMA,EMA technical analysis, forecast prediction, by indicators ADX,MACD,RSI,CCI USA stock exchange
operates under Finance sector & deals in Major Banks
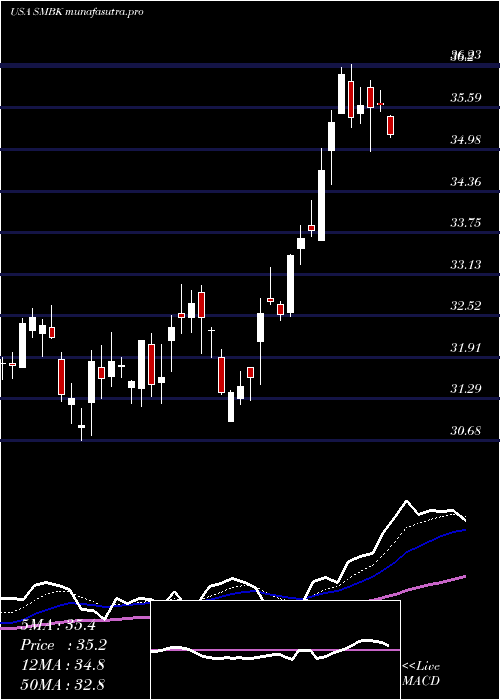
Daily price and charts and targets SmartfinancialInc Strong Daily Stock price targets for SmartfinancialInc SMBK are 37.27 and 37.75 | Daily Target 1 | 36.92 | | Daily Target 2 | 37.14 | | Daily Target 3 | 37.396666666667 | | Daily Target 4 | 37.62 | | Daily Target 5 | 37.88 |
Daily price and volume Smartfinancial Inc
| Date |
Closing |
Open |
Range |
Volume |
Thu 04 December 2025 |
37.37 (-0.03%) |
37.34 |
37.17 - 37.65 |
1.3188 times |
Wed 03 December 2025 |
37.38 (2.27%) |
36.72 |
36.41 - 37.39 |
1.9031 times |
Tue 02 December 2025 |
36.55 (0.03%) |
36.90 |
36.46 - 37.02 |
0.9159 times |
Mon 01 December 2025 |
36.54 (0.77%) |
36.13 |
36.13 - 36.82 |
0.9224 times |
Fri 28 November 2025 |
36.26 (-0.82%) |
36.76 |
36.11 - 36.95 |
0.5208 times |
Wed 26 November 2025 |
36.56 (0.16%) |
36.50 |
36.38 - 36.71 |
1.0131 times |
Tue 25 November 2025 |
36.50 (2.82%) |
35.87 |
35.68 - 36.74 |
1.1517 times |
Mon 24 November 2025 |
35.50 (-0.48%) |
35.42 |
35.21 - 35.88 |
0.6037 times |
Fri 21 November 2025 |
35.67 (2.94%) |
34.85 |
34.85 - 35.97 |
0.8317 times |
Thu 20 November 2025 |
34.65 (-0.03%) |
35.11 |
34.54 - 35.70 |
0.8188 times |
Wed 19 November 2025 |
34.66 (-0.43%) |
34.93 |
34.50 - 34.93 |
0.5791 times |
Weekly price and charts SmartfinancialInc Strong weekly Stock price targets for SmartfinancialInc SMBK are 36.75 and 38.27 | Weekly Target 1 | 35.53 | | Weekly Target 2 | 36.45 | | Weekly Target 3 | 37.05 | | Weekly Target 4 | 37.97 | | Weekly Target 5 | 38.57 |
Weekly price and volumes for Smartfinancial Inc
| Date |
Closing |
Open |
Range |
Volume |
Thu 04 December 2025 |
37.37 (3.06%) |
36.13 |
36.13 - 37.65 |
1.3504 times |
Fri 28 November 2025 |
36.26 (1.65%) |
35.42 |
35.21 - 36.95 |
0.8778 times |
Fri 21 November 2025 |
35.67 (-0.94%) |
35.81 |
34.50 - 36.46 |
0.9476 times |
Fri 14 November 2025 |
36.01 (1.35%) |
35.63 |
35.34 - 37.23 |
1.078 times |
Fri 07 November 2025 |
35.53 (1.6%) |
34.34 |
34.23 - 36.14 |
0.827 times |
Fri 31 October 2025 |
34.97 (0%) |
35.04 |
34.70 - 35.36 |
0.2247 times |
Fri 31 October 2025 |
34.97 (-1.63%) |
35.70 |
34.28 - 36.01 |
1.0773 times |
Fri 24 October 2025 |
35.55 (3.04%) |
34.95 |
34.53 - 36.50 |
1.0963 times |
Fri 17 October 2025 |
34.50 (-1.71%) |
35.29 |
33.01 - 36.20 |
1.605 times |
Fri 03 October 2025 |
35.10 (-4.12%) |
36.79 |
34.59 - 36.79 |
0.9159 times |
Fri 26 September 2025 |
36.61 (-0.76%) |
36.74 |
36.34 - 37.56 |
0.7696 times |
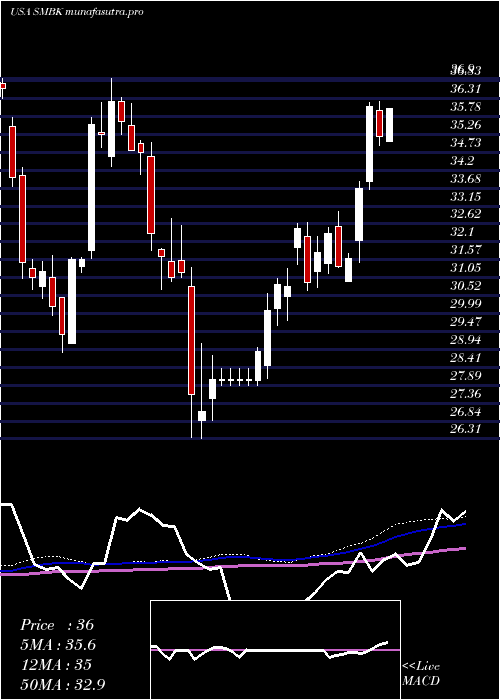
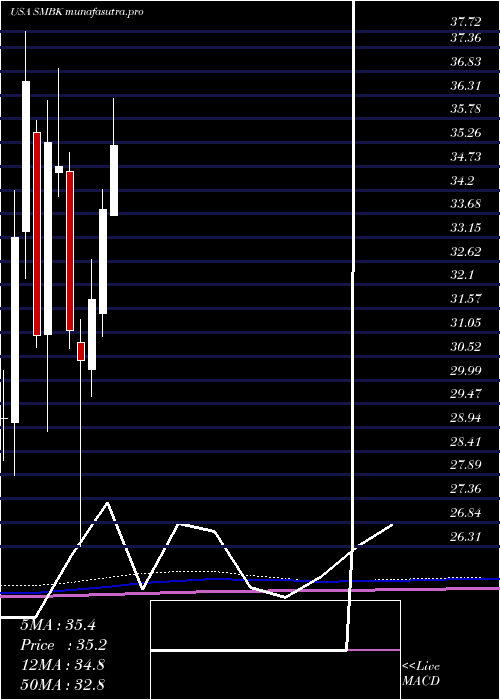
Monthly price and charts SmartfinancialInc Strong monthly Stock price targets for SmartfinancialInc SMBK are 36.75 and 38.27 | Monthly Target 1 | 35.53 | | Monthly Target 2 | 36.45 | | Monthly Target 3 | 37.05 | | Monthly Target 4 | 37.97 | | Monthly Target 5 | 38.57 |
Monthly price and volumes Smartfinancial Inc
| Date |
Closing |
Open |
Range |
Volume |
Thu 04 December 2025 |
37.37 (3.06%) |
36.13 |
36.13 - 37.65 |
0.3665 times |
Fri 28 November 2025 |
36.26 (3.69%) |
34.34 |
34.23 - 37.23 |
1.0124 times |
Fri 31 October 2025 |
34.97 (-2.13%) |
35.60 |
33.01 - 36.50 |
1.2609 times |
Tue 30 September 2025 |
35.73 (-3.04%) |
36.41 |
35.42 - 37.92 |
0.9705 times |
Fri 29 August 2025 |
36.85 (7.56%) |
33.90 |
32.63 - 37.32 |
0.9529 times |
Thu 31 July 2025 |
34.26 (1.42%) |
33.63 |
33.63 - 37.25 |
1.1599 times |
Mon 30 June 2025 |
33.78 (6.29%) |
31.46 |
30.95 - 34.22 |
1.262 times |
Fri 30 May 2025 |
31.78 (4.47%) |
30.22 |
29.63 - 32.67 |
0.9748 times |
Wed 30 April 2025 |
30.42 (-2.12%) |
30.83 |
26.31 - 31.34 |
1.1308 times |
Mon 31 March 2025 |
31.08 (-10.48%) |
34.62 |
30.69 - 35.03 |
0.9094 times |
Fri 28 February 2025 |
34.72 (-1.53%) |
34.60 |
34.07 - 36.90 |
0.6775 times |
DMA SMA EMA moving averages of Smartfinancial Inc SMBK
DMA (daily moving average) of Smartfinancial Inc SMBK
| DMA period | DMA value | | 5 day DMA | 36.82 | | 12 day DMA | 36.04 | | 20 day DMA | 35.87 | | 35 day DMA | 35.55 | | 50 day DMA | 35.69 | | 100 day DMA | 35.71 | | 150 day DMA | 34.49 | | 200 day DMA | 33.66 | EMA (exponential moving average) of Smartfinancial Inc SMBK
| EMA period | EMA current | EMA prev | EMA prev2 | | 5 day EMA | 36.92 | 36.69 | 36.34 | | 12 day EMA | 36.37 | 36.19 | 35.97 | | 20 day EMA | 36.09 | 35.96 | 35.81 | | 35 day EMA | 35.96 | 35.88 | 35.79 | | 50 day EMA | 35.9 | 35.84 | 35.78 |
SMA (simple moving average) of Smartfinancial Inc SMBK
| SMA period | SMA current | SMA prev | SMA prev2 | | 5 day SMA | 36.82 | 36.66 | 36.48 | | 12 day SMA | 36.04 | 35.81 | 35.69 | | 20 day SMA | 35.87 | 35.79 | 35.68 | | 35 day SMA | 35.55 | 35.47 | 35.4 | | 50 day SMA | 35.69 | 35.68 | 35.66 | | 100 day SMA | 35.71 | 35.69 | 35.67 | | 150 day SMA | 34.49 | 34.44 | 34.38 | | 200 day SMA | 33.66 | 33.65 | 33.65 |
|
|
