SouthernMissouri SMBC full analysis,charts,indicators,moving averages,SMA,DMA,EMA,ADX,MACD,RSISouthern Missouri SMBC WideScreen charts, DMA,SMA,EMA technical analysis, forecast prediction, by indicators ADX,MACD,RSI,CCI USA stock exchange
operates under Finance sector & deals in Banks
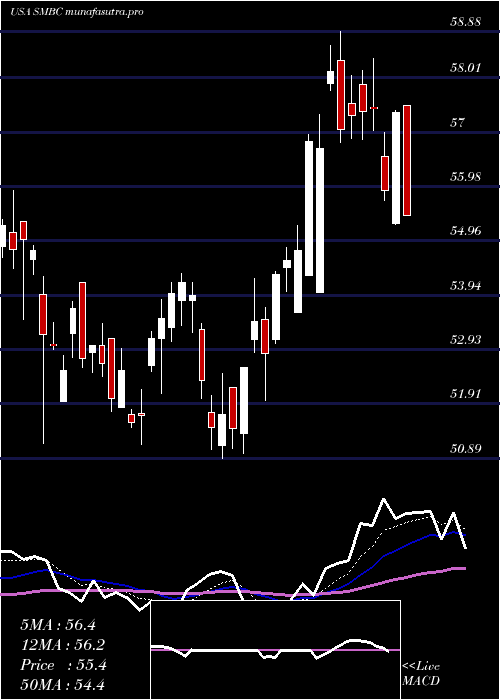
Daily price and charts and targets SouthernMissouri Strong Daily Stock price targets for SouthernMissouri SMBC are 57.9 and 58.75 | Daily Target 1 | 57.72 | | Daily Target 2 | 58.07 | | Daily Target 3 | 58.566666666667 | | Daily Target 4 | 58.92 | | Daily Target 5 | 59.42 |
Daily price and volume Southern Missouri
| Date |
Closing |
Open |
Range |
Volume |
Thu 04 December 2025 |
58.43 (-0.36%) |
58.52 |
58.21 - 59.06 |
0.6625 times |
Wed 03 December 2025 |
58.64 (3.09%) |
57.55 |
57.37 - 58.66 |
0.9425 times |
Tue 02 December 2025 |
56.88 (-0.42%) |
57.59 |
56.71 - 57.68 |
1.2246 times |
Mon 01 December 2025 |
57.12 (1.47%) |
56.31 |
55.91 - 57.29 |
0.9724 times |
Fri 28 November 2025 |
56.29 (-0.65%) |
56.84 |
56.10 - 57.13 |
0.5172 times |
Wed 26 November 2025 |
56.66 (0.05%) |
56.30 |
56.13 - 57.25 |
0.8378 times |
Tue 25 November 2025 |
56.63 (2.42%) |
55.43 |
55.43 - 56.89 |
0.8955 times |
Mon 24 November 2025 |
55.29 (-0.45%) |
55.21 |
55.10 - 55.75 |
1.2909 times |
Fri 21 November 2025 |
55.54 (2.57%) |
54.15 |
54.15 - 56.09 |
1.2054 times |
Thu 20 November 2025 |
54.15 (1.88%) |
53.53 |
53.53 - 54.72 |
1.4512 times |
Wed 19 November 2025 |
53.15 (0.34%) |
52.77 |
52.76 - 53.91 |
1.3593 times |
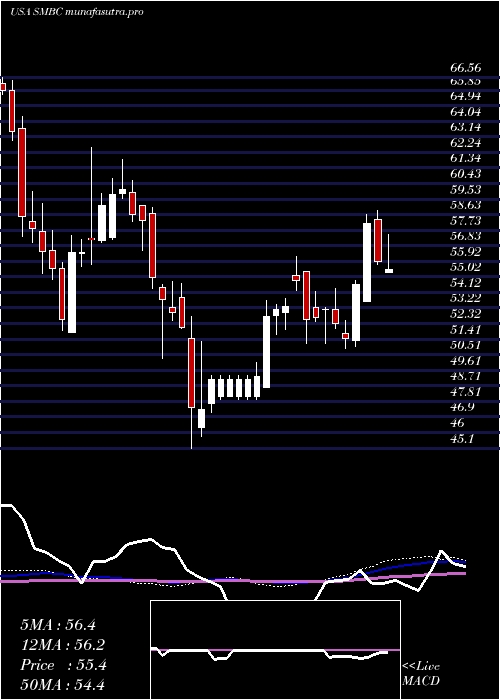
Weekly price and charts SouthernMissouri Strong weekly Stock price targets for SouthernMissouri SMBC are 57.17 and 60.32 | Weekly Target 1 | 54.65 | | Weekly Target 2 | 56.54 | | Weekly Target 3 | 57.8 | | Weekly Target 4 | 59.69 | | Weekly Target 5 | 60.95 |
Weekly price and volumes for Southern Missouri
| Date |
Closing |
Open |
Range |
Volume |
Thu 04 December 2025 |
58.43 (3.8%) |
56.31 |
55.91 - 59.06 |
0.6655 times |
Fri 28 November 2025 |
56.29 (1.35%) |
55.21 |
55.10 - 57.25 |
0.6199 times |
Fri 21 November 2025 |
55.54 (2.02%) |
54.18 |
52.72 - 56.09 |
1.0426 times |
Fri 14 November 2025 |
54.44 (1.76%) |
54.10 |
53.69 - 55.57 |
1.2345 times |
Fri 07 November 2025 |
53.50 (2.02%) |
52.95 |
52.52 - 55.10 |
1.074 times |
Fri 31 October 2025 |
52.44 (0%) |
52.44 |
52.09 - 54.02 |
0.2409 times |
Fri 31 October 2025 |
52.44 (-0.94%) |
52.99 |
52.09 - 54.24 |
1.493 times |
Fri 24 October 2025 |
52.94 (10.04%) |
48.05 |
48.05 - 53.34 |
1.493 times |
Fri 17 October 2025 |
48.11 (-3.37%) |
50.58 |
47.60 - 51.70 |
0.9678 times |
Fri 10 October 2025 |
49.79 (-3.38%) |
52.02 |
49.77 - 53.65 |
1.1687 times |
Fri 03 October 2025 |
51.53 (-5.1%) |
54.41 |
51.43 - 54.43 |
1.2367 times |
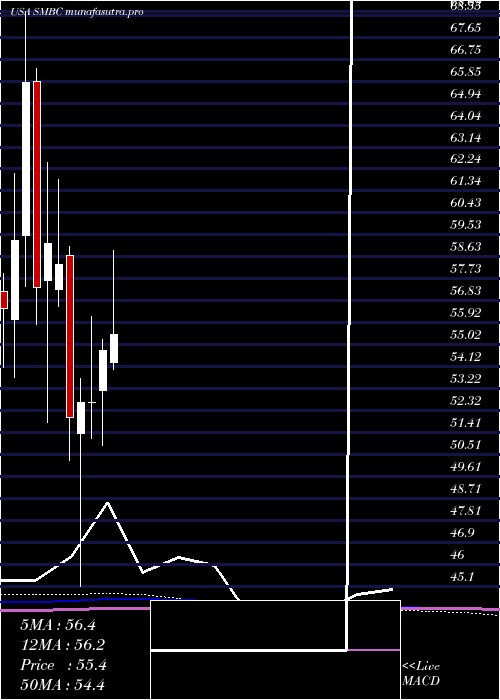
Monthly price and charts SouthernMissouri Strong monthly Stock price targets for SouthernMissouri SMBC are 57.17 and 60.32 | Monthly Target 1 | 54.65 | | Monthly Target 2 | 56.54 | | Monthly Target 3 | 57.8 | | Monthly Target 4 | 59.69 | | Monthly Target 5 | 60.95 |
Monthly price and volumes Southern Missouri
| Date |
Closing |
Open |
Range |
Volume |
Thu 04 December 2025 |
58.43 (3.8%) |
56.31 |
55.91 - 59.06 |
0.226 times |
Fri 28 November 2025 |
56.29 (7.34%) |
52.95 |
52.52 - 57.25 |
1.3484 times |
Fri 31 October 2025 |
52.44 (-0.23%) |
52.40 |
47.60 - 54.24 |
2.1066 times |
Tue 30 September 2025 |
52.56 (-8.65%) |
57.24 |
52.45 - 59.03 |
1.1491 times |
Fri 29 August 2025 |
57.54 (6.38%) |
53.64 |
51.59 - 58.45 |
0.772 times |
Thu 31 July 2025 |
54.09 (-1.26%) |
54.31 |
53.78 - 58.88 |
1.5275 times |
Mon 30 June 2025 |
54.78 (4.03%) |
53.13 |
50.89 - 55.25 |
1.0037 times |
Fri 30 May 2025 |
52.66 (0.02%) |
52.63 |
51.17 - 56.19 |
0.6587 times |
Wed 30 April 2025 |
52.65 (1.21%) |
51.38 |
45.10 - 53.63 |
0.6728 times |
Mon 31 March 2025 |
52.02 (-10.77%) |
58.67 |
50.28 - 59.05 |
0.5353 times |
Fri 28 February 2025 |
58.30 (-1.49%) |
57.29 |
56.58 - 61.82 |
0.6861 times |
DMA SMA EMA moving averages of Southern Missouri SMBC
DMA (daily moving average) of Southern Missouri SMBC
| DMA period | DMA value | | 5 day DMA | 57.47 | | 12 day DMA | 55.98 | | 20 day DMA | 55.23 | | 35 day DMA | 53.77 | | 50 day DMA | 53.31 | | 100 day DMA | 54.53 | | 150 day DMA | 54.37 | | 200 day DMA | 53.89 | EMA (exponential moving average) of Southern Missouri SMBC
| EMA period | EMA current | EMA prev | EMA prev2 | | 5 day EMA | 57.62 | 57.22 | 56.51 | | 12 day EMA | 56.44 | 56.08 | 55.62 | | 20 day EMA | 55.62 | 55.32 | 54.97 | | 35 day EMA | 54.69 | 54.47 | 54.22 | | 50 day EMA | 53.9 | 53.72 | 53.52 |
SMA (simple moving average) of Southern Missouri SMBC
| SMA period | SMA current | SMA prev | SMA prev2 | | 5 day SMA | 57.47 | 57.12 | 56.72 | | 12 day SMA | 55.98 | 55.53 | 55.18 | | 20 day SMA | 55.23 | 55 | 54.78 | | 35 day SMA | 53.77 | 53.56 | 53.35 | | 50 day SMA | 53.31 | 53.24 | 53.17 | | 100 day SMA | 54.53 | 54.5 | 54.49 | | 150 day SMA | 54.37 | 54.33 | 54.29 | | 200 day SMA | 53.89 | 53.9 | 53.91 |
|
|
