SolarCapital SLRC full analysis,charts,indicators,moving averages,SMA,DMA,EMA,ADX,MACD,RSISolar Capital SLRC WideScreen charts, DMA,SMA,EMA technical analysis, forecast prediction, by indicators ADX,MACD,RSI,CCI USA stock exchange
operates under N A sector & deals in N A
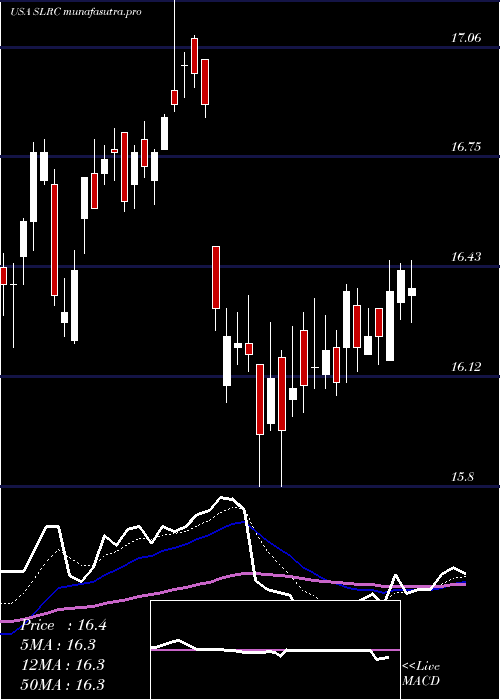
Daily price and charts and targets SolarCapital Strong Daily Stock price targets for SolarCapital SLRC are 14.34 and 14.58 | Daily Target 1 | 14.15 | | Daily Target 2 | 14.28 | | Daily Target 3 | 14.386666666667 | | Daily Target 4 | 14.52 | | Daily Target 5 | 14.63 |
Daily price and volume Solar Capital
| Date |
Closing |
Open |
Range |
Volume |
Tue 21 October 2025 |
14.42 (0.98%) |
14.25 |
14.25 - 14.49 |
0.9958 times |
Mon 20 October 2025 |
14.28 (0.92%) |
14.17 |
14.08 - 14.30 |
0.6045 times |
Fri 17 October 2025 |
14.15 (1.36%) |
14.00 |
13.95 - 14.22 |
1.1255 times |
Thu 16 October 2025 |
13.96 (-3.12%) |
14.40 |
13.96 - 14.47 |
1.4648 times |
Wed 15 October 2025 |
14.41 (-0.55%) |
14.55 |
14.33 - 14.72 |
0.68 times |
Tue 14 October 2025 |
14.49 (1.19%) |
14.24 |
14.24 - 14.56 |
0.7505 times |
Mon 13 October 2025 |
14.32 (1.78%) |
14.10 |
14.10 - 14.41 |
1.2192 times |
Fri 10 October 2025 |
14.07 (-1.33%) |
14.24 |
14.00 - 14.36 |
1.2483 times |
Thu 09 October 2025 |
14.26 (-1.72%) |
14.50 |
14.20 - 14.61 |
1.204 times |
Wed 08 October 2025 |
14.51 (-0.89%) |
14.65 |
14.51 - 14.76 |
0.7074 times |
Tue 07 October 2025 |
14.64 (-1.41%) |
14.82 |
14.55 - 14.94 |
0.8526 times |
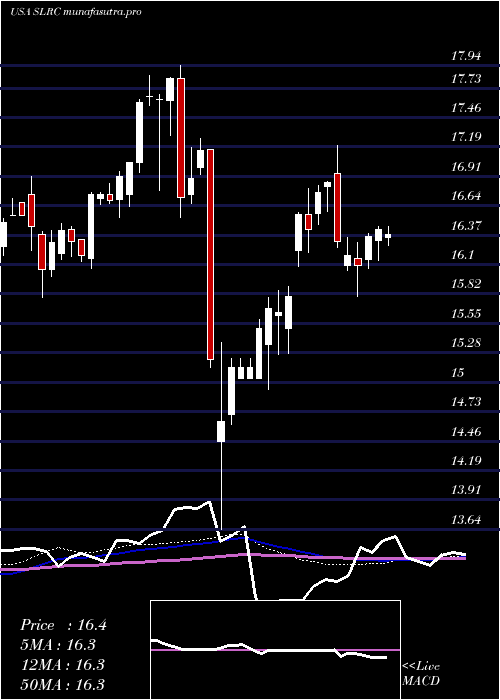
Weekly price and charts SolarCapital Strong weekly Stock price targets for SolarCapital SLRC are 14.25 and 14.66 | Weekly Target 1 | 13.92 | | Weekly Target 2 | 14.17 | | Weekly Target 3 | 14.33 | | Weekly Target 4 | 14.58 | | Weekly Target 5 | 14.74 |
Weekly price and volumes for Solar Capital
| Date |
Closing |
Open |
Range |
Volume |
Tue 21 October 2025 |
14.42 (1.91%) |
14.17 |
14.08 - 14.49 |
0.5386 times |
Fri 17 October 2025 |
14.15 (0.57%) |
14.10 |
13.95 - 14.72 |
1.7635 times |
Fri 10 October 2025 |
14.07 (-5.89%) |
14.95 |
14.00 - 15.06 |
1.5765 times |
Fri 03 October 2025 |
14.95 (-3.17%) |
15.46 |
14.92 - 15.55 |
1.2092 times |
Fri 26 September 2025 |
15.44 (-4.51%) |
16.12 |
15.36 - 16.14 |
1.2577 times |
Fri 19 September 2025 |
16.17 (0.62%) |
16.09 |
15.86 - 16.20 |
1.004 times |
Fri 12 September 2025 |
16.07 (-3.77%) |
16.70 |
15.96 - 16.83 |
1.354 times |
Fri 05 September 2025 |
16.70 (0.48%) |
16.62 |
16.51 - 16.75 |
0.5163 times |
Fri 29 August 2025 |
16.62 (0%) |
16.54 |
16.40 - 16.63 |
0.1089 times |
Fri 29 August 2025 |
16.62 (1.16%) |
16.45 |
16.21 - 16.63 |
0.6712 times |
Fri 22 August 2025 |
16.43 (0.8%) |
16.34 |
16.26 - 16.69 |
0.7659 times |
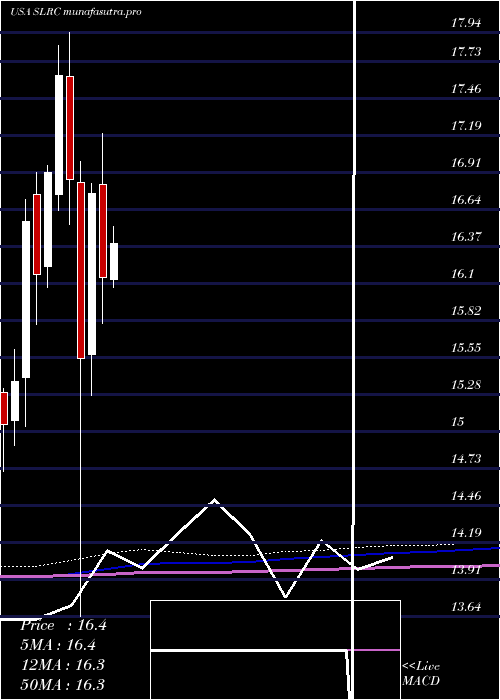
Monthly price and charts SolarCapital Strong monthly Stock price targets for SolarCapital SLRC are 13.51 and 14.87 | Monthly Target 1 | 13.2 | | Monthly Target 2 | 13.81 | | Monthly Target 3 | 14.56 | | Monthly Target 4 | 15.17 | | Monthly Target 5 | 15.92 |
Monthly price and volumes Solar Capital
| Date |
Closing |
Open |
Range |
Volume |
Tue 21 October 2025 |
14.42 (-5.69%) |
15.23 |
13.95 - 15.31 |
1.2766 times |
Tue 30 September 2025 |
15.29 (-8%) |
16.62 |
15.18 - 16.83 |
1.2557 times |
Fri 29 August 2025 |
16.62 (3.88%) |
15.92 |
15.62 - 16.69 |
0.8512 times |
Thu 31 July 2025 |
16.00 (-0.87%) |
16.12 |
15.93 - 16.70 |
0.8924 times |
Mon 30 June 2025 |
16.14 (-3.7%) |
16.82 |
15.80 - 17.20 |
0.9994 times |
Fri 30 May 2025 |
16.76 (7.85%) |
15.57 |
15.27 - 16.83 |
0.7448 times |
Wed 30 April 2025 |
15.54 (-7.83%) |
16.84 |
13.64 - 16.99 |
1.307 times |
Mon 31 March 2025 |
16.86 (-4.37%) |
17.62 |
16.53 - 17.94 |
0.9915 times |
Fri 28 February 2025 |
17.63 (4.26%) |
16.75 |
16.63 - 17.85 |
0.8398 times |
Fri 31 January 2025 |
16.91 (4.64%) |
16.22 |
16.06 - 16.96 |
0.8415 times |
Tue 31 December 2024 |
16.16 (-2.36%) |
16.75 |
15.79 - 16.91 |
0.734 times |
DMA SMA EMA moving averages of Solar Capital SLRC
DMA (daily moving average) of Solar Capital SLRC
| DMA period | DMA value | | 5 day DMA | 14.24 | | 12 day DMA | 14.36 | | 20 day DMA | 14.73 | | 35 day DMA | 15.4 | | 50 day DMA | 15.72 | | 100 day DMA | 16.05 | | 150 day DMA | 16.01 | | 200 day DMA | 16.26 | EMA (exponential moving average) of Solar Capital SLRC
| EMA period | EMA current | EMA prev | EMA prev2 | | 5 day EMA | 14.31 | 14.25 | 14.23 | | 12 day EMA | 14.46 | 14.47 | 14.51 | | 20 day EMA | 14.73 | 14.76 | 14.81 | | 35 day EMA | 15.17 | 15.21 | 15.27 | | 50 day EMA | 15.63 | 15.68 | 15.74 |
SMA (simple moving average) of Solar Capital SLRC
| SMA period | SMA current | SMA prev | SMA prev2 | | 5 day SMA | 14.24 | 14.26 | 14.27 | | 12 day SMA | 14.36 | 14.41 | 14.48 | | 20 day SMA | 14.73 | 14.79 | 14.87 | | 35 day SMA | 15.4 | 15.47 | 15.53 | | 50 day SMA | 15.72 | 15.76 | 15.81 | | 100 day SMA | 16.05 | 16.07 | 16.1 | | 150 day SMA | 16.01 | 16.02 | 16.04 | | 200 day SMA | 16.26 | 16.27 | 16.28 |
|
|
