SimulationsPlus SLP full analysis,charts,indicators,moving averages,SMA,DMA,EMA,ADX,MACD,RSISimulations Plus SLP WideScreen charts, DMA,SMA,EMA technical analysis, forecast prediction, by indicators ADX,MACD,RSI,CCI USA stock exchange
operates under Technology sector & deals in EDP Services
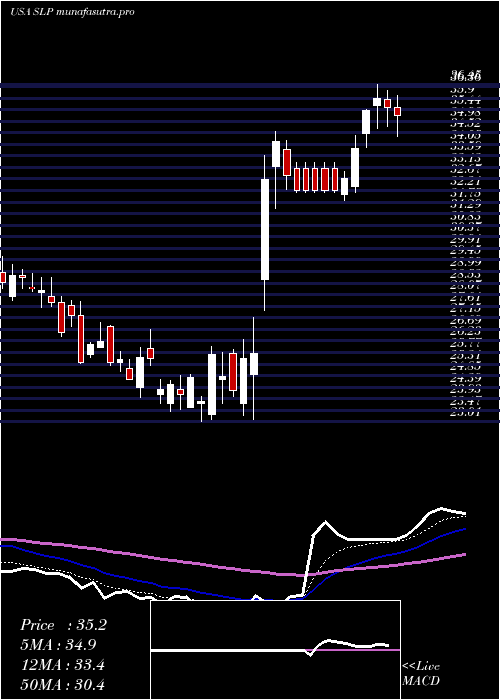
Daily price and charts and targets SimulationsPlus Strong Daily Stock price targets for SimulationsPlus SLP are 14.78 and 15.78 | Daily Target 1 | 14.57 | | Daily Target 2 | 14.98 | | Daily Target 3 | 15.566666666667 | | Daily Target 4 | 15.98 | | Daily Target 5 | 16.57 |
Daily price and volume Simulations Plus
| Date |
Closing |
Open |
Range |
Volume |
Fri 17 October 2025 |
15.40 (-3.87%) |
15.80 |
15.15 - 16.15 |
0.5443 times |
Thu 16 October 2025 |
16.02 (2.69%) |
15.72 |
15.72 - 16.34 |
1.0608 times |
Wed 15 October 2025 |
15.60 (2.23%) |
15.41 |
15.33 - 15.90 |
0.6886 times |
Tue 14 October 2025 |
15.26 (-1.1%) |
15.27 |
15.09 - 15.66 |
0.6875 times |
Mon 13 October 2025 |
15.43 (4.54%) |
14.96 |
14.73 - 15.46 |
1.0492 times |
Fri 10 October 2025 |
14.76 (-6.05%) |
15.84 |
14.70 - 16.05 |
1.3173 times |
Thu 09 October 2025 |
15.71 (-4.61%) |
16.48 |
15.62 - 16.53 |
0.6955 times |
Wed 08 October 2025 |
16.47 (-0.18%) |
16.54 |
16.33 - 16.76 |
1.0123 times |
Tue 07 October 2025 |
16.50 (-0.3%) |
16.66 |
16.21 - 16.77 |
1.127 times |
Mon 06 October 2025 |
16.55 (3.31%) |
16.04 |
16.00 - 16.80 |
1.8176 times |
Fri 03 October 2025 |
16.02 (1.14%) |
15.63 |
15.63 - 16.19 |
1.2089 times |
Weekly price and charts SimulationsPlus Strong weekly Stock price targets for SimulationsPlus SLP are 15.07 and 16.68 | Weekly Target 1 | 13.88 | | Weekly Target 2 | 14.64 | | Weekly Target 3 | 15.49 | | Weekly Target 4 | 16.25 | | Weekly Target 5 | 17.1 |
Weekly price and volumes for Simulations Plus
| Date |
Closing |
Open |
Range |
Volume |
Fri 17 October 2025 |
15.40 (4.34%) |
14.96 |
14.73 - 16.34 |
0.8235 times |
Fri 10 October 2025 |
14.76 (-7.87%) |
16.04 |
14.70 - 16.80 |
1.2198 times |
Fri 03 October 2025 |
16.02 (7.59%) |
14.86 |
14.46 - 16.19 |
1.0547 times |
Fri 26 September 2025 |
14.89 (-2.36%) |
15.42 |
14.52 - 15.68 |
1.0196 times |
Fri 19 September 2025 |
15.25 (1.33%) |
15.12 |
14.43 - 16.27 |
2.4324 times |
Fri 12 September 2025 |
15.05 (8.74%) |
13.76 |
13.28 - 15.07 |
1.2796 times |
Fri 05 September 2025 |
13.84 (-2.33%) |
14.10 |
13.81 - 14.52 |
0.5186 times |
Fri 29 August 2025 |
14.17 (0%) |
14.23 |
13.93 - 14.36 |
0.0823 times |
Fri 29 August 2025 |
14.17 (-2.75%) |
14.45 |
13.84 - 14.45 |
0.7448 times |
Fri 22 August 2025 |
14.57 (2.32%) |
14.29 |
13.70 - 14.88 |
0.8247 times |
Fri 15 August 2025 |
14.24 (0.49%) |
14.20 |
13.76 - 14.59 |
0.8316 times |
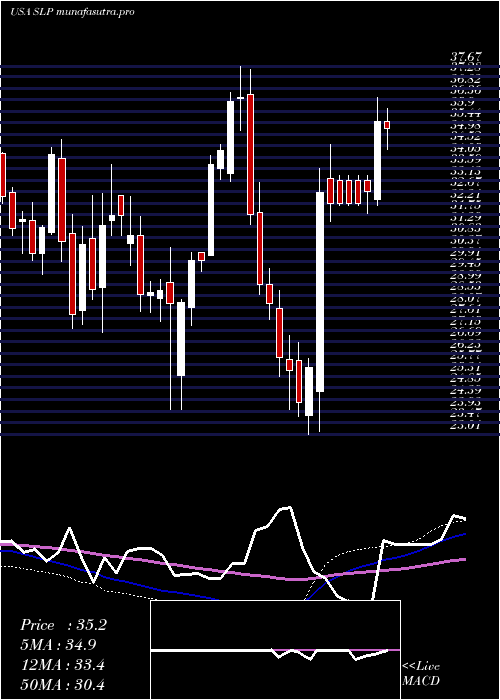
Monthly price and charts SimulationsPlus Strong monthly Stock price targets for SimulationsPlus SLP are 15.05 and 17.15 | Monthly Target 1 | 13.53 | | Monthly Target 2 | 14.47 | | Monthly Target 3 | 15.633333333333 | | Monthly Target 4 | 16.57 | | Monthly Target 5 | 17.73 |
Monthly price and volumes Simulations Plus
| Date |
Closing |
Open |
Range |
Volume |
Fri 17 October 2025 |
15.40 (2.19%) |
15.10 |
14.70 - 16.80 |
0.7046 times |
Tue 30 September 2025 |
15.07 (6.35%) |
14.10 |
13.28 - 16.27 |
1.4413 times |
Fri 29 August 2025 |
14.17 (8.83%) |
12.93 |
12.51 - 14.88 |
0.8835 times |
Thu 31 July 2025 |
13.02 (-25.39%) |
17.28 |
12.39 - 18.95 |
2.4364 times |
Mon 30 June 2025 |
17.45 (-45.21%) |
31.41 |
16.72 - 31.67 |
1.2489 times |
Fri 30 May 2025 |
31.85 (-7.28%) |
34.34 |
27.85 - 34.34 |
0.6355 times |
Wed 30 April 2025 |
34.35 (40.09%) |
24.31 |
23.01 - 36.45 |
1.0456 times |
Mon 31 March 2025 |
24.52 (-15.39%) |
28.97 |
23.44 - 29.60 |
0.3666 times |
Fri 28 February 2025 |
28.98 (-15.56%) |
33.41 |
28.56 - 37.67 |
0.3479 times |
Fri 31 January 2025 |
34.32 (23.05%) |
28.26 |
24.00 - 34.58 |
0.8896 times |
Tue 31 December 2024 |
27.89 (-12.07%) |
30.61 |
27.51 - 32.50 |
0.3306 times |

DMA SMA EMA moving averages of Simulations Plus SLP
DMA (daily moving average) of Simulations Plus SLP
| DMA period | DMA value | | 5 day DMA | 15.54 | | 12 day DMA | 15.8 | | 20 day DMA | 15.48 | | 35 day DMA | 15.11 | | 50 day DMA | 14.83 | | 100 day DMA | 16.79 | | 150 day DMA | 21.19 | | 200 day DMA | 23.77 | EMA (exponential moving average) of Simulations Plus SLP
| EMA period | EMA current | EMA prev | EMA prev2 | | 5 day EMA | 15.59 | 15.68 | 15.51 | | 12 day EMA | 15.58 | 15.61 | 15.54 | | 20 day EMA | 15.45 | 15.45 | 15.39 | | 35 day EMA | 15.14 | 15.12 | 15.07 | | 50 day EMA | 14.78 | 14.75 | 14.7 |
SMA (simple moving average) of Simulations Plus SLP
| SMA period | SMA current | SMA prev | SMA prev2 | | 5 day SMA | 15.54 | 15.41 | 15.35 | | 12 day SMA | 15.8 | 15.8 | 15.72 | | 20 day SMA | 15.48 | 15.47 | 15.46 | | 35 day SMA | 15.11 | 15.07 | 15.02 | | 50 day SMA | 14.83 | 14.8 | 14.76 | | 100 day SMA | 16.79 | 16.96 | 17.13 | | 150 day SMA | 21.19 | 21.25 | 21.33 | | 200 day SMA | 23.77 | 23.83 | 23.89 |
|
|
