SiliconLaboratories SLAB full analysis,charts,indicators,moving averages,SMA,DMA,EMA,ADX,MACD,RSISilicon Laboratories SLAB WideScreen charts, DMA,SMA,EMA technical analysis, forecast prediction, by indicators ADX,MACD,RSI,CCI USA stock exchange
operates under Technology sector & deals in Semiconductors
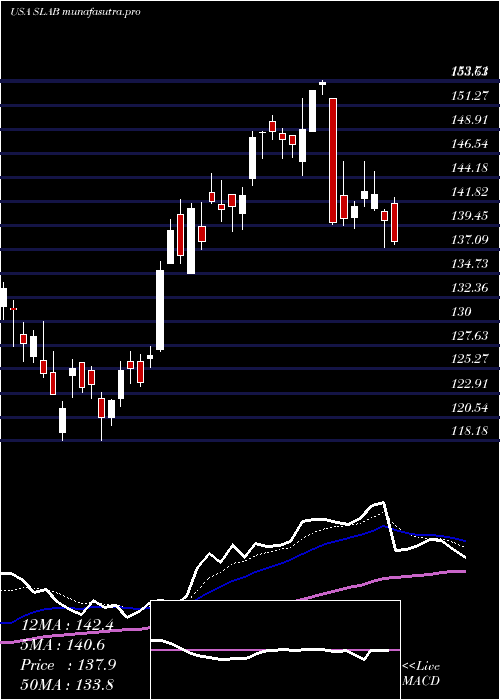
Daily price and charts and targets SiliconLaboratories Strong Daily Stock price targets for SiliconLaboratories SLAB are 131.49 and 135.3 | Daily Target 1 | 130.64 | | Daily Target 2 | 132.34 | | Daily Target 3 | 134.45 | | Daily Target 4 | 136.15 | | Daily Target 5 | 138.26 |
Daily price and volume Silicon Laboratories
| Date |
Closing |
Open |
Range |
Volume |
Tue 21 October 2025 |
134.04 (-2.5%) |
136.35 |
132.75 - 136.56 |
1.0429 times |
Mon 20 October 2025 |
137.48 (1.01%) |
137.73 |
133.57 - 139.88 |
0.9886 times |
Fri 17 October 2025 |
136.11 (-1.21%) |
136.50 |
135.01 - 137.87 |
0.7629 times |
Thu 16 October 2025 |
137.78 (0.36%) |
138.32 |
134.92 - 138.94 |
0.9467 times |
Wed 15 October 2025 |
137.29 (4.97%) |
133.31 |
131.81 - 137.39 |
0.9498 times |
Tue 14 October 2025 |
130.79 (1.35%) |
125.14 |
125.14 - 132.00 |
0.9913 times |
Mon 13 October 2025 |
129.05 (5.62%) |
126.33 |
125.45 - 130.00 |
0.9639 times |
Fri 10 October 2025 |
122.18 (-8.86%) |
133.78 |
121.75 - 134.05 |
1.8401 times |
Thu 09 October 2025 |
134.06 (-0.63%) |
134.99 |
131.84 - 135.59 |
0.6619 times |
Wed 08 October 2025 |
134.91 (2.45%) |
132.00 |
131.09 - 135.86 |
0.8519 times |
Tue 07 October 2025 |
131.69 (-2.55%) |
135.90 |
131.10 - 136.90 |
0.8334 times |
Weekly price and charts SiliconLaboratories Strong weekly Stock price targets for SiliconLaboratories SLAB are 129.83 and 136.96 | Weekly Target 1 | 128.43 | | Weekly Target 2 | 131.23 | | Weekly Target 3 | 135.55666666667 | | Weekly Target 4 | 138.36 | | Weekly Target 5 | 142.69 |
Weekly price and volumes for Silicon Laboratories
| Date |
Closing |
Open |
Range |
Volume |
Tue 21 October 2025 |
134.04 (-1.52%) |
137.73 |
132.75 - 139.88 |
0.4683 times |
Fri 17 October 2025 |
136.11 (11.4%) |
126.33 |
125.14 - 138.94 |
1.0637 times |
Fri 10 October 2025 |
122.18 (-9.01%) |
137.44 |
121.75 - 137.44 |
1.2537 times |
Fri 03 October 2025 |
134.28 (2.79%) |
131.70 |
128.59 - 137.25 |
1.0076 times |
Fri 26 September 2025 |
130.64 (-4.77%) |
137.44 |
128.15 - 139.03 |
1.1347 times |
Fri 19 September 2025 |
137.18 (2.54%) |
135.00 |
132.50 - 143.46 |
1.4183 times |
Fri 12 September 2025 |
133.78 (-1.25%) |
136.57 |
131.81 - 136.57 |
0.9093 times |
Fri 05 September 2025 |
135.48 (0.84%) |
130.00 |
127.41 - 138.55 |
1.0443 times |
Fri 29 August 2025 |
134.35 (0%) |
137.17 |
133.42 - 137.17 |
0.2543 times |
Fri 29 August 2025 |
134.35 (-7.42%) |
144.51 |
133.42 - 145.13 |
1.4459 times |
Fri 22 August 2025 |
145.12 (11.06%) |
130.98 |
128.96 - 145.78 |
1.4486 times |
Monthly price and charts SiliconLaboratories Strong monthly Stock price targets for SiliconLaboratories SLAB are 127.9 and 146.03 | Monthly Target 1 | 113.76 | | Monthly Target 2 | 123.9 | | Monthly Target 3 | 131.89 | | Monthly Target 4 | 142.03 | | Monthly Target 5 | 150.02 |
Monthly price and volumes Silicon Laboratories
| Date |
Closing |
Open |
Range |
Volume |
Tue 21 October 2025 |
134.04 (2.22%) |
129.53 |
121.75 - 139.88 |
0.4441 times |
Tue 30 September 2025 |
131.13 (-2.4%) |
130.00 |
127.41 - 143.46 |
0.6746 times |
Fri 29 August 2025 |
134.35 (1.96%) |
128.24 |
119.59 - 145.78 |
1.0589 times |
Thu 31 July 2025 |
131.77 (-10.58%) |
145.76 |
129.54 - 153.71 |
1.3036 times |
Mon 30 June 2025 |
147.36 (22.26%) |
120.45 |
119.66 - 150.25 |
1.0257 times |
Fri 30 May 2025 |
120.53 (18.45%) |
102.59 |
100.87 - 135.19 |
1.0123 times |
Wed 30 April 2025 |
101.76 (-9.6%) |
112.23 |
82.82 - 117.79 |
1.4989 times |
Mon 31 March 2025 |
112.57 (-19.76%) |
140.71 |
109.91 - 141.25 |
0.9091 times |
Fri 28 February 2025 |
140.30 (3.47%) |
132.06 |
129.27 - 160.00 |
1.1813 times |
Fri 31 January 2025 |
135.59 (9.15%) |
125.56 |
123.74 - 141.86 |
0.8915 times |
Tue 31 December 2024 |
124.22 (15.41%) |
117.60 |
117.48 - 133.59 |
0.6061 times |
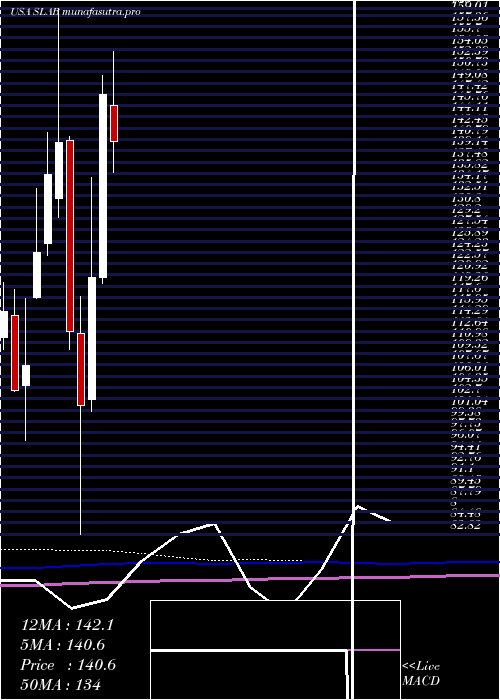
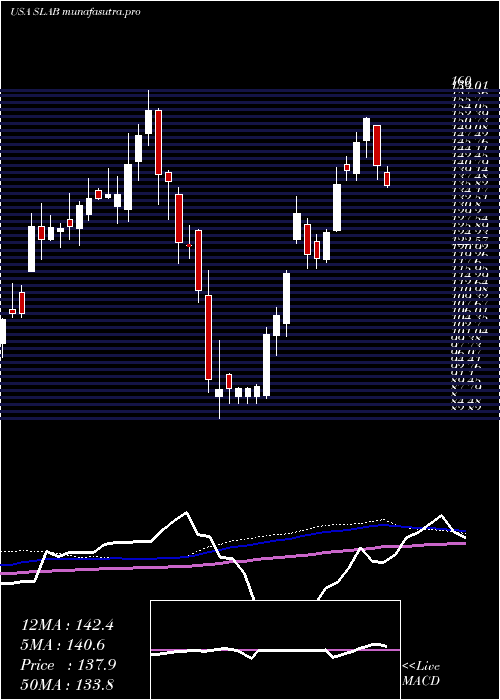
DMA SMA EMA moving averages of Silicon Laboratories SLAB
DMA (daily moving average) of Silicon Laboratories SLAB
| DMA period | DMA value | | 5 day DMA | 136.54 | | 12 day DMA | 133.38 | | 20 day DMA | 132.59 | | 35 day DMA | 133.69 | | 50 day DMA | 134.33 | | 100 day DMA | 135.79 | | 150 day DMA | 127.04 | | 200 day DMA | 129.8 | EMA (exponential moving average) of Silicon Laboratories SLAB
| EMA period | EMA current | EMA prev | EMA prev2 | | 5 day EMA | 135.16 | 135.72 | 134.84 | | 12 day EMA | 134.09 | 134.1 | 133.49 | | 20 day EMA | 133.69 | 133.65 | 133.25 | | 35 day EMA | 133.42 | 133.38 | 133.14 | | 50 day EMA | 133.85 | 133.84 | 133.69 |
SMA (simple moving average) of Silicon Laboratories SLAB
| SMA period | SMA current | SMA prev | SMA prev2 | | 5 day SMA | 136.54 | 135.89 | 134.2 | | 12 day SMA | 133.38 | 133.4 | 133.07 | | 20 day SMA | 132.59 | 132.56 | 132.54 | | 35 day SMA | 133.69 | 133.59 | 133.5 | | 50 day SMA | 134.33 | 134.27 | 134.01 | | 100 day SMA | 135.79 | 135.68 | 135.56 | | 150 day SMA | 127.04 | 126.98 | 126.87 | | 200 day SMA | 129.8 | 129.75 | 129.69 |
|
|
