FlexsharesCredit SKOR full analysis,charts,indicators,moving averages,SMA,DMA,EMA,ADX,MACD,RSIFlexshares Credit SKOR WideScreen charts, DMA,SMA,EMA technical analysis, forecast prediction, by indicators ADX,MACD,RSI,CCI USA stock exchange
operates under N A sector & deals in N A
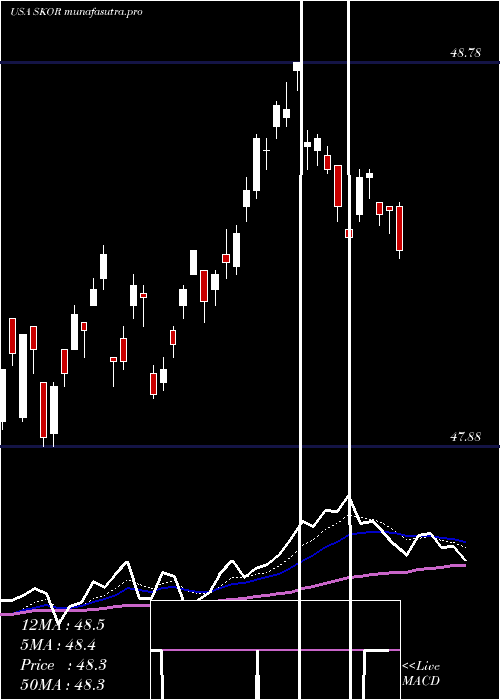
Daily price and charts and targets FlexsharesCredit Strong Daily Stock price targets for FlexsharesCredit SKOR are 49.13 and 49.17 | Daily Target 1 | 49.12 | | Daily Target 2 | 49.14 | | Daily Target 3 | 49.16 | | Daily Target 4 | 49.18 | | Daily Target 5 | 49.2 |
Daily price and volume Flexshares Credit
| Date |
Closing |
Open |
Range |
Volume |
Thu 04 December 2025 |
49.16 (-0.14%) |
49.18 |
49.14 - 49.18 |
0.2534 times |
Wed 03 December 2025 |
49.23 (0.14%) |
49.19 |
49.17 - 49.23 |
0.2771 times |
Tue 02 December 2025 |
49.16 (0.08%) |
49.11 |
49.10 - 49.16 |
0.3565 times |
Mon 01 December 2025 |
49.12 (-0.61%) |
49.14 |
49.08 - 49.14 |
0.572 times |
Fri 28 November 2025 |
49.42 (-0.04%) |
49.42 |
49.37 - 49.43 |
0.2641 times |
Wed 26 November 2025 |
49.44 (0.12%) |
49.36 |
49.33 - 49.45 |
0.2724 times |
Tue 25 November 2025 |
49.38 (0.2%) |
49.29 |
49.28 - 49.43 |
0.5069 times |
Mon 24 November 2025 |
49.28 (0.12%) |
49.26 |
49.22 - 49.28 |
0.3896 times |
Fri 21 November 2025 |
49.22 (0.29%) |
49.19 |
49.14 - 49.22 |
1.2257 times |
Thu 20 November 2025 |
49.08 (0.06%) |
49.17 |
49.06 - 49.17 |
5.8823 times |
Wed 19 November 2025 |
49.05 (-0.02%) |
49.12 |
49.03 - 49.12 |
0.424 times |
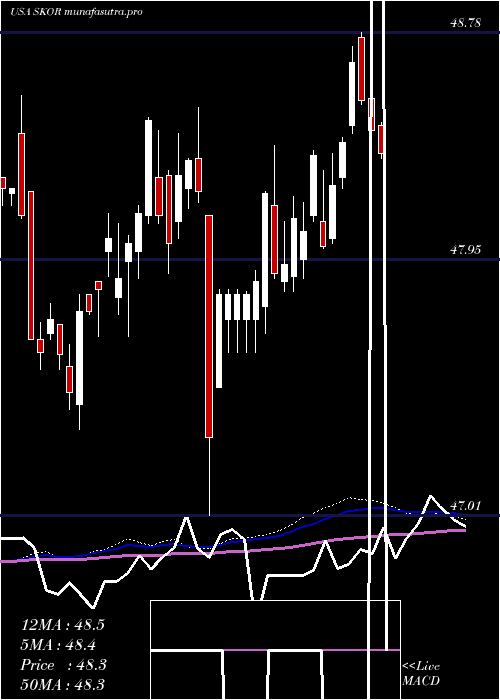
Weekly price and charts FlexsharesCredit Strong weekly Stock price targets for FlexsharesCredit SKOR are 49.12 and 49.27 | Weekly Target 1 | 49.01 | | Weekly Target 2 | 49.08 | | Weekly Target 3 | 49.156666666667 | | Weekly Target 4 | 49.23 | | Weekly Target 5 | 49.31 |
Weekly price and volumes for Flexshares Credit
| Date |
Closing |
Open |
Range |
Volume |
Thu 04 December 2025 |
49.16 (-0.53%) |
49.14 |
49.08 - 49.23 |
0.6365 times |
Fri 28 November 2025 |
49.42 (0.41%) |
49.26 |
49.22 - 49.45 |
0.6252 times |
Fri 21 November 2025 |
49.22 (0.41%) |
49.02 |
49.01 - 49.22 |
3.7133 times |
Fri 14 November 2025 |
49.02 (-0.08%) |
49.06 |
49.01 - 49.20 |
1.1372 times |
Fri 07 November 2025 |
49.06 (-0.35%) |
49.02 |
48.94 - 49.11 |
0.5327 times |
Fri 31 October 2025 |
49.23 (0%) |
49.30 |
49.22 - 49.30 |
0.1813 times |
Fri 31 October 2025 |
49.23 (-0.49%) |
49.45 |
49.22 - 49.51 |
0.7662 times |
Fri 24 October 2025 |
49.47 (0.2%) |
49.39 |
49.39 - 49.49 |
0.8721 times |
Fri 17 October 2025 |
49.37 (0.45%) |
49.16 |
49.16 - 49.44 |
0.7848 times |
Fri 10 October 2025 |
49.15 (-0.06%) |
49.11 |
49.08 - 49.20 |
0.7507 times |
Fri 03 October 2025 |
49.18 (0.04%) |
49.21 |
49.12 - 49.29 |
1.0721 times |
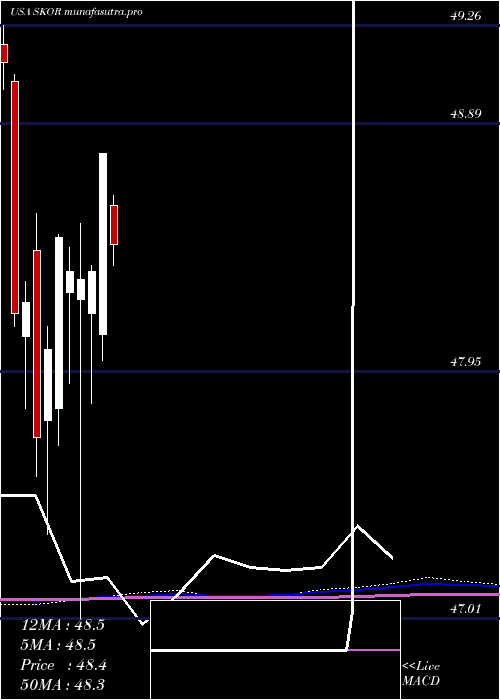
Monthly price and charts FlexsharesCredit Strong monthly Stock price targets for FlexsharesCredit SKOR are 49.12 and 49.27 | Monthly Target 1 | 49.01 | | Monthly Target 2 | 49.08 | | Monthly Target 3 | 49.156666666667 | | Monthly Target 4 | 49.23 | | Monthly Target 5 | 49.31 |
Monthly price and volumes Flexshares Credit
| Date |
Closing |
Open |
Range |
Volume |
Thu 04 December 2025 |
49.16 (-0.53%) |
49.14 |
49.08 - 49.23 |
0.1345 times |
Fri 28 November 2025 |
49.42 (0.39%) |
49.02 |
48.94 - 49.45 |
1.2697 times |
Fri 31 October 2025 |
49.23 (-0.04%) |
49.16 |
49.08 - 49.51 |
0.8344 times |
Tue 30 September 2025 |
49.25 (0.29%) |
48.72 |
48.72 - 49.46 |
1.0259 times |
Fri 29 August 2025 |
49.11 (0.86%) |
48.73 |
48.66 - 49.11 |
0.7902 times |
Thu 31 July 2025 |
48.69 (-0.18%) |
48.58 |
48.32 - 48.77 |
1.0948 times |
Mon 30 June 2025 |
48.78 (0.93%) |
48.09 |
47.99 - 48.78 |
1.0285 times |
Fri 30 May 2025 |
48.33 (0.06%) |
48.17 |
47.83 - 48.35 |
1.0441 times |
Wed 30 April 2025 |
48.30 (-0.06%) |
48.22 |
47.01 - 48.51 |
1.4134 times |
Mon 31 March 2025 |
48.33 (-0.27%) |
48.25 |
47.90 - 48.42 |
1.3645 times |
Fri 28 February 2025 |
48.46 (0.9%) |
47.81 |
47.67 - 48.47 |
1.4666 times |
DMA SMA EMA moving averages of Flexshares Credit SKOR
DMA (daily moving average) of Flexshares Credit SKOR
| DMA period | DMA value | | 5 day DMA | 49.22 | | 12 day DMA | 49.22 | | 20 day DMA | 49.16 | | 35 day DMA | 49.24 | | 50 day DMA | 49.23 | | 100 day DMA | 49.08 | | 150 day DMA | 48.8 | | 200 day DMA | 48.61 | EMA (exponential moving average) of Flexshares Credit SKOR
| EMA period | EMA current | EMA prev | EMA prev2 | | 5 day EMA | 49.21 | 49.23 | 49.23 | | 12 day EMA | 49.21 | 49.22 | 49.22 | | 20 day EMA | 49.21 | 49.21 | 49.21 | | 35 day EMA | 49.2 | 49.2 | 49.2 | | 50 day EMA | 49.24 | 49.24 | 49.24 |
SMA (simple moving average) of Flexshares Credit SKOR
| SMA period | SMA current | SMA prev | SMA prev2 | | 5 day SMA | 49.22 | 49.27 | 49.3 | | 12 day SMA | 49.22 | 49.21 | 49.19 | | 20 day SMA | 49.16 | 49.15 | 49.14 | | 35 day SMA | 49.24 | 49.24 | 49.24 | | 50 day SMA | 49.23 | 49.23 | 49.23 | | 100 day SMA | 49.08 | 49.07 | 49.07 | | 150 day SMA | 48.8 | 48.8 | 48.79 | | 200 day SMA | 48.61 | 48.61 | 48.6 |
|
|
