SanJuan SJT full analysis,charts,indicators,moving averages,SMA,DMA,EMA,ADX,MACD,RSISan Juan SJT WideScreen charts, DMA,SMA,EMA technical analysis, forecast prediction, by indicators ADX,MACD,RSI,CCI USA stock exchange
operates under Energy sector & deals in Oil Gas Production
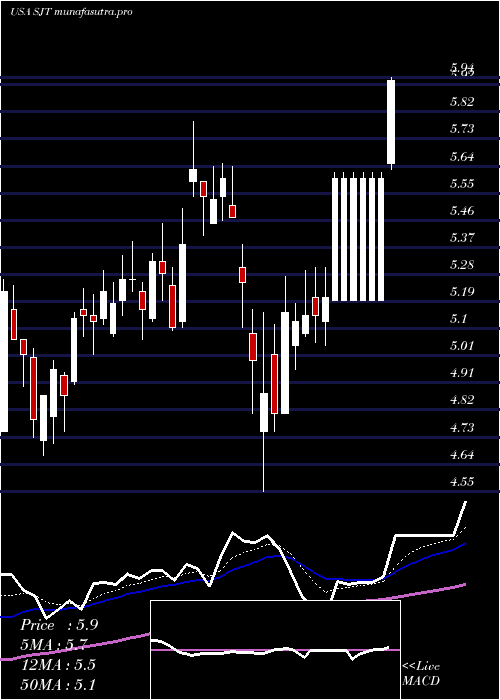
Daily price and charts and targets SanJuan Strong Daily Stock price targets for SanJuan SJT are 5.63 and 5.74 | Daily Target 1 | 5.54 | | Daily Target 2 | 5.6 | | Daily Target 3 | 5.6533333333333 | | Daily Target 4 | 5.71 | | Daily Target 5 | 5.76 |
Daily price and volume San Juan
| Date |
Closing |
Open |
Range |
Volume |
Tue 21 October 2025 |
5.65 (0%) |
5.61 |
5.60 - 5.71 |
0.759 times |
Mon 20 October 2025 |
5.65 (3.48%) |
5.52 |
5.49 - 5.74 |
0.9372 times |
Fri 17 October 2025 |
5.46 (-1.97%) |
5.61 |
5.46 - 5.61 |
1.3739 times |
Thu 16 October 2025 |
5.57 (-5.43%) |
5.96 |
5.50 - 5.97 |
1.3646 times |
Wed 15 October 2025 |
5.89 (0.68%) |
5.87 |
5.85 - 5.93 |
0.7173 times |
Tue 14 October 2025 |
5.85 (-0.51%) |
5.83 |
5.80 - 5.90 |
1.021 times |
Mon 13 October 2025 |
5.88 (-6.07%) |
5.87 |
5.80 - 5.99 |
1.1066 times |
Tue 07 October 2025 |
6.26 (-2.03%) |
6.36 |
6.24 - 6.38 |
1.2489 times |
Mon 06 October 2025 |
6.39 (-1.24%) |
6.48 |
6.29 - 6.52 |
0.6534 times |
Fri 03 October 2025 |
6.47 (2.05%) |
6.33 |
6.33 - 6.61 |
0.818 times |
Thu 02 October 2025 |
6.34 (0.16%) |
6.35 |
6.28 - 6.49 |
0.9698 times |
Weekly price and charts SanJuan Strong weekly Stock price targets for SanJuan SJT are 5.57 and 5.82 | Weekly Target 1 | 5.38 | | Weekly Target 2 | 5.51 | | Weekly Target 3 | 5.6266666666667 | | Weekly Target 4 | 5.76 | | Weekly Target 5 | 5.88 |
Weekly price and volumes for San Juan
| Date |
Closing |
Open |
Range |
Volume |
Tue 21 October 2025 |
5.65 (3.48%) |
5.52 |
5.49 - 5.74 |
0.4747 times |
Fri 17 October 2025 |
5.46 (-12.78%) |
5.87 |
5.46 - 5.99 |
1.5624 times |
Tue 07 October 2025 |
6.26 (-3.25%) |
6.48 |
6.24 - 6.52 |
0.5323 times |
Fri 03 October 2025 |
6.47 (8.19%) |
5.96 |
5.76 - 6.61 |
1.5121 times |
Fri 26 September 2025 |
5.98 (3.82%) |
5.75 |
5.68 - 6.36 |
1.4012 times |
Fri 19 September 2025 |
5.76 (-0.35%) |
5.74 |
5.71 - 5.96 |
1.0816 times |
Fri 12 September 2025 |
5.78 (0%) |
5.83 |
5.73 - 5.91 |
0.7637 times |
Fri 05 September 2025 |
5.78 (0.52%) |
5.71 |
5.69 - 5.86 |
0.84 times |
Fri 29 August 2025 |
5.75 (0%) |
5.72 |
5.72 - 5.85 |
0.1777 times |
Fri 29 August 2025 |
5.75 (-0.69%) |
5.74 |
5.71 - 6.03 |
1.6544 times |
Fri 22 August 2025 |
5.79 (0.35%) |
5.76 |
5.54 - 5.93 |
1.4859 times |

Monthly price and charts SanJuan Strong monthly Stock price targets for SanJuan SJT are 4.98 and 6.13 | Monthly Target 1 | 4.76 | | Monthly Target 2 | 5.2 | | Monthly Target 3 | 5.9066666666667 | | Monthly Target 4 | 6.35 | | Monthly Target 5 | 7.06 |
Monthly price and volumes San Juan
| Date |
Closing |
Open |
Range |
Volume |
Tue 21 October 2025 |
5.65 (-6.46%) |
6.05 |
5.46 - 6.61 |
0.5797 times |
Tue 30 September 2025 |
6.04 (5.04%) |
5.71 |
5.68 - 6.36 |
0.771 times |
Fri 29 August 2025 |
5.75 (-4.96%) |
6.00 |
5.54 - 6.04 |
1.0037 times |
Thu 31 July 2025 |
6.05 (1.17%) |
6.03 |
5.65 - 6.42 |
0.7884 times |
Mon 30 June 2025 |
5.98 (-4.78%) |
6.38 |
5.57 - 7.00 |
0.916 times |
Fri 30 May 2025 |
6.28 (8.28%) |
5.79 |
5.72 - 7.22 |
1.6395 times |
Wed 30 April 2025 |
5.80 (4.88%) |
5.54 |
4.55 - 6.32 |
1.082 times |
Mon 31 March 2025 |
5.53 (10.38%) |
5.00 |
4.67 - 5.79 |
0.7911 times |
Fri 28 February 2025 |
5.01 (20.14%) |
4.14 |
3.77 - 5.44 |
1.3344 times |
Fri 31 January 2025 |
4.17 (8.88%) |
3.86 |
3.85 - 4.81 |
1.0941 times |
Tue 31 December 2024 |
3.83 (-6.36%) |
4.06 |
3.66 - 4.37 |
0.9368 times |

DMA SMA EMA moving averages of San Juan SJT
DMA (daily moving average) of San Juan SJT
| DMA period | DMA value | | 5 day DMA | 5.64 | | 12 day DMA | 5.98 | | 20 day DMA | 5.95 | | 35 day DMA | 5.88 | | 50 day DMA | 5.84 | | 100 day DMA | 6 | | 150 day DMA | 5.92 | | 200 day DMA | 5.58 | EMA (exponential moving average) of San Juan SJT
| EMA period | EMA current | EMA prev | EMA prev2 | | 5 day EMA | 5.68 | 5.7 | 5.73 | | 12 day EMA | 5.83 | 5.86 | 5.9 | | 20 day EMA | 5.87 | 5.89 | 5.92 | | 35 day EMA | 5.89 | 5.9 | 5.91 | | 50 day EMA | 5.82 | 5.83 | 5.84 |
SMA (simple moving average) of San Juan SJT
| SMA period | SMA current | SMA prev | SMA prev2 | | 5 day SMA | 5.64 | 5.68 | 5.73 | | 12 day SMA | 5.98 | 6.01 | 6.03 | | 20 day SMA | 5.95 | 5.96 | 5.97 | | 35 day SMA | 5.88 | 5.88 | 5.89 | | 50 day SMA | 5.84 | 5.85 | 5.85 | | 100 day SMA | 6 | 6.02 | 6.03 | | 150 day SMA | 5.92 | 5.92 | 5.91 | | 200 day SMA | 5.58 | 5.57 | 5.56 |
|
|
