JM SJM full analysis,charts,indicators,moving averages,SMA,DMA,EMA,ADX,MACD,RSIJ M SJM WideScreen charts, DMA,SMA,EMA technical analysis, forecast prediction, by indicators ADX,MACD,RSI,CCI USA stock exchange
operates under Consumer Non Durables sector & deals in Packaged Foods
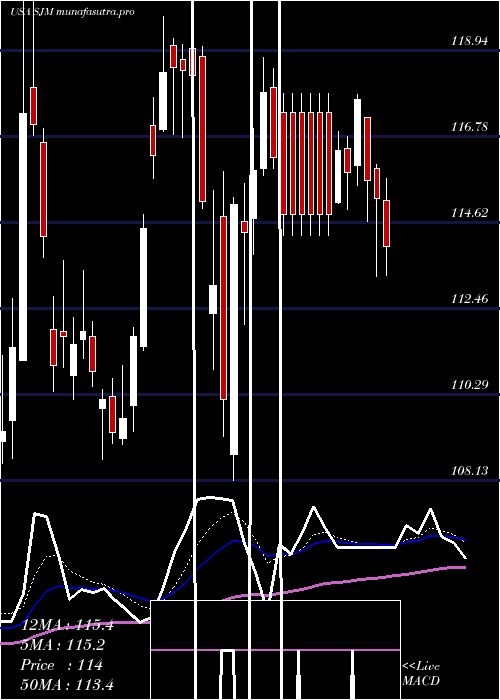
Daily price and charts and targets JM Strong Daily Stock price targets for JM SJM are 101.41 and 103.45 | Daily Target 1 | 101.01 | | Daily Target 2 | 101.8 | | Daily Target 3 | 103.05 | | Daily Target 4 | 103.84 | | Daily Target 5 | 105.09 |
Daily price and volume J M
| Date |
Closing |
Open |
Range |
Volume |
Thu 23 October 2025 |
102.59 (-2.06%) |
104.30 |
102.26 - 104.30 |
1.5791 times |
Wed 22 October 2025 |
104.75 (0.01%) |
104.80 |
103.56 - 105.95 |
1.3725 times |
Tue 21 October 2025 |
104.74 (-0.59%) |
105.50 |
104.71 - 105.88 |
0.5967 times |
Mon 20 October 2025 |
105.36 (0.06%) |
105.22 |
104.33 - 105.85 |
0.8493 times |
Fri 17 October 2025 |
105.30 (1.36%) |
104.26 |
103.67 - 105.79 |
0.97 times |
Thu 16 October 2025 |
103.89 (0.36%) |
103.66 |
103.64 - 106.57 |
1.0158 times |
Wed 15 October 2025 |
103.52 (1.07%) |
101.87 |
101.68 - 103.61 |
0.7604 times |
Tue 14 October 2025 |
102.42 (0.92%) |
101.61 |
100.76 - 102.57 |
1.1652 times |
Mon 13 October 2025 |
101.49 (-3.11%) |
104.20 |
100.69 - 105.21 |
0.9311 times |
Fri 10 October 2025 |
104.75 (-0.35%) |
105.68 |
104.55 - 106.32 |
0.7597 times |
Thu 09 October 2025 |
105.12 (-0.76%) |
105.88 |
104.64 - 105.99 |
0.5276 times |
Weekly price and charts JM Strong weekly Stock price targets for JM SJM are 100.58 and 104.27 | Weekly Target 1 | 99.91 | | Weekly Target 2 | 101.25 | | Weekly Target 3 | 103.6 | | Weekly Target 4 | 104.94 | | Weekly Target 5 | 107.29 |
Weekly price and volumes for J M
| Date |
Closing |
Open |
Range |
Volume |
Thu 23 October 2025 |
102.59 (-2.57%) |
105.22 |
102.26 - 105.95 |
0.6968 times |
Fri 17 October 2025 |
105.30 (0.53%) |
104.20 |
100.69 - 106.57 |
0.7673 times |
Fri 10 October 2025 |
104.75 (-3.28%) |
107.95 |
104.55 - 109.17 |
0.5733 times |
Fri 03 October 2025 |
108.30 (-0.83%) |
109.13 |
106.70 - 110.92 |
0.7865 times |
Fri 26 September 2025 |
109.21 (0.4%) |
109.00 |
106.53 - 111.00 |
1.3518 times |
Fri 19 September 2025 |
108.78 (0.91%) |
107.84 |
102.23 - 109.40 |
1.8149 times |
Fri 12 September 2025 |
107.80 (-4.19%) |
111.79 |
107.80 - 112.05 |
0.7595 times |
Fri 05 September 2025 |
112.51 (1.81%) |
110.46 |
108.14 - 114.11 |
0.7752 times |
Fri 29 August 2025 |
110.51 (0%) |
107.45 |
107.02 - 110.74 |
0.3122 times |
Fri 29 August 2025 |
110.51 (-2.38%) |
112.74 |
100.25 - 113.34 |
2.1626 times |
Fri 22 August 2025 |
113.20 (2.2%) |
111.00 |
110.22 - 114.74 |
1.1578 times |
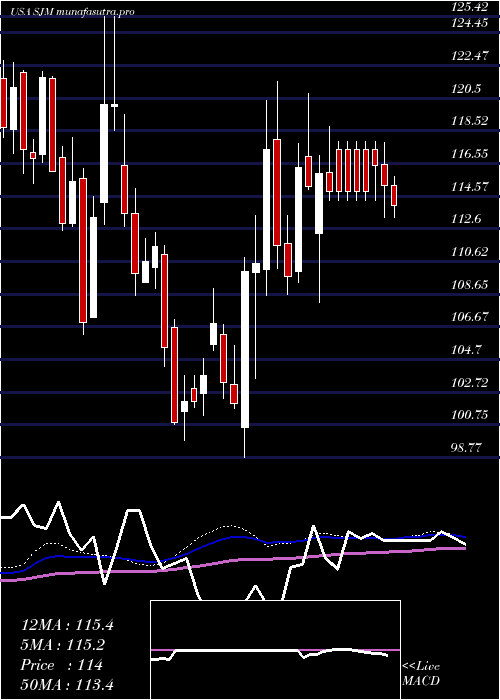
Monthly price and charts JM Strong monthly Stock price targets for JM SJM are 96.53 and 106.76 | Monthly Target 1 | 94.5 | | Monthly Target 2 | 98.55 | | Monthly Target 3 | 104.73333333333 | | Monthly Target 4 | 108.78 | | Monthly Target 5 | 114.96 |
Monthly price and volumes J M
| Date |
Closing |
Open |
Range |
Volume |
Thu 23 October 2025 |
102.59 (-5.53%) |
108.77 |
100.69 - 110.92 |
0.6593 times |
Tue 30 September 2025 |
108.60 (-1.73%) |
110.46 |
102.23 - 114.11 |
1.383 times |
Fri 29 August 2025 |
110.51 (2.95%) |
108.30 |
100.25 - 114.74 |
1.3485 times |
Thu 31 July 2025 |
107.34 (9.31%) |
98.40 |
98.33 - 112.13 |
1.3593 times |
Mon 30 June 2025 |
98.20 (-12.8%) |
112.59 |
93.30 - 113.24 |
1.6241 times |
Fri 30 May 2025 |
112.61 (-3.15%) |
114.78 |
109.37 - 115.61 |
0.6339 times |
Wed 30 April 2025 |
116.27 (-1.81%) |
119.08 |
108.13 - 120.76 |
0.7416 times |
Mon 31 March 2025 |
118.41 (7.13%) |
110.12 |
108.57 - 121.48 |
0.812 times |
Fri 28 February 2025 |
110.53 (3.41%) |
106.21 |
98.77 - 113.39 |
0.7934 times |
Fri 31 January 2025 |
106.89 (-2.93%) |
110.61 |
99.81 - 112.35 |
0.6451 times |
Tue 31 December 2024 |
110.12 (-8.3%) |
116.45 |
108.55 - 119.49 |
0.5283 times |

DMA SMA EMA moving averages of J M SJM
DMA (daily moving average) of J M SJM
| DMA period | DMA value | | 5 day DMA | 104.55 | | 12 day DMA | 104.15 | | 20 day DMA | 105.75 | | 35 day DMA | 106.86 | | 50 day DMA | 108.06 | | 100 day DMA | 106.62 | | 150 day DMA | 109.2 | | 200 day DMA | 108.64 | EMA (exponential moving average) of J M SJM
| EMA period | EMA current | EMA prev | EMA prev2 | | 5 day EMA | 104 | 104.7 | 104.67 | | 12 day EMA | 104.63 | 105 | 105.05 | | 20 day EMA | 105.39 | 105.69 | 105.79 | | 35 day EMA | 106.69 | 106.93 | 107.06 | | 50 day EMA | 107.97 | 108.19 | 108.33 |
SMA (simple moving average) of J M SJM
| SMA period | SMA current | SMA prev | SMA prev2 | | 5 day SMA | 104.55 | 104.81 | 104.56 | | 12 day SMA | 104.15 | 104.62 | 104.81 | | 20 day SMA | 105.75 | 106.01 | 106.29 | | 35 day SMA | 106.86 | 107.14 | 107.35 | | 50 day SMA | 108.06 | 108.24 | 108.4 | | 100 day SMA | 106.62 | 106.72 | 106.8 | | 150 day SMA | 109.2 | 109.24 | 109.27 | | 200 day SMA | 108.64 | 108.65 | 108.65 |
|
|
