SiteCenters SITC full analysis,charts,indicators,moving averages,SMA,DMA,EMA,ADX,MACD,RSISite Centers SITC WideScreen charts, DMA,SMA,EMA technical analysis, forecast prediction, by indicators ADX,MACD,RSI,CCI USA stock exchange
operates under Consumer Services sector & deals in Real Estate Investment Trusts
Daily price and charts and targets SiteCenters Strong Daily Stock price targets for SiteCenters SITC are 7.17 and 7.26 | Daily Target 1 | 7.15 | | Daily Target 2 | 7.18 | | Daily Target 3 | 7.2366666666667 | | Daily Target 4 | 7.27 | | Daily Target 5 | 7.33 |
Daily price and volume Site Centers
| Date |
Closing |
Open |
Range |
Volume |
Thu 04 December 2025 |
7.22 (-0.69%) |
7.26 |
7.20 - 7.29 |
0.7548 times |
Wed 03 December 2025 |
7.27 (0.97%) |
7.19 |
7.18 - 7.28 |
0.6359 times |
Tue 02 December 2025 |
7.20 (-2.31%) |
7.37 |
7.17 - 7.37 |
0.5589 times |
Mon 01 December 2025 |
7.37 (0.14%) |
7.29 |
7.26 - 7.41 |
0.7985 times |
Fri 28 November 2025 |
7.36 (-0.14%) |
7.32 |
7.28 - 7.37 |
0.399 times |
Wed 26 November 2025 |
7.37 (-0.27%) |
7.33 |
7.33 - 7.47 |
0.9886 times |
Tue 25 November 2025 |
7.39 (2.21%) |
7.23 |
7.23 - 7.49 |
1.3857 times |
Mon 24 November 2025 |
7.23 (2.26%) |
7.11 |
7.06 - 7.27 |
2.591 times |
Fri 21 November 2025 |
7.07 (4.12%) |
6.85 |
6.76 - 7.08 |
0.9305 times |
Thu 20 November 2025 |
6.79 (-1.45%) |
6.97 |
6.78 - 7.00 |
0.9571 times |
Wed 19 November 2025 |
6.89 (-0.14%) |
6.91 |
6.87 - 6.95 |
0.7186 times |
Weekly price and charts SiteCenters Strong weekly Stock price targets for SiteCenters SITC are 7.08 and 7.32 | Weekly Target 1 | 7.03 | | Weekly Target 2 | 7.12 | | Weekly Target 3 | 7.2666666666667 | | Weekly Target 4 | 7.36 | | Weekly Target 5 | 7.51 |
Weekly price and volumes for Site Centers
| Date |
Closing |
Open |
Range |
Volume |
Thu 04 December 2025 |
7.22 (-1.9%) |
7.29 |
7.17 - 7.41 |
0.6733 times |
Fri 28 November 2025 |
7.36 (4.1%) |
7.11 |
7.06 - 7.49 |
1.3143 times |
Fri 21 November 2025 |
7.07 (2.02%) |
6.96 |
6.76 - 7.08 |
1.074 times |
Fri 14 November 2025 |
6.93 (-4.81%) |
7.29 |
6.85 - 7.34 |
1.2769 times |
Fri 07 November 2025 |
7.28 (-0.68%) |
7.28 |
6.89 - 7.48 |
1.4228 times |
Fri 31 October 2025 |
7.33 (0%) |
7.42 |
7.28 - 7.47 |
0.2874 times |
Fri 31 October 2025 |
7.33 (-17.18%) |
8.88 |
7.28 - 8.91 |
1.423 times |
Fri 24 October 2025 |
8.85 (2.55%) |
8.66 |
8.57 - 8.95 |
1.1561 times |
Fri 17 October 2025 |
8.63 (0.58%) |
8.48 |
8.42 - 8.81 |
0.9782 times |
Tue 07 October 2025 |
8.58 (-2.61%) |
8.84 |
8.45 - 8.85 |
0.394 times |
Fri 03 October 2025 |
8.81 (-1.23%) |
8.91 |
8.72 - 9.08 |
0.9841 times |
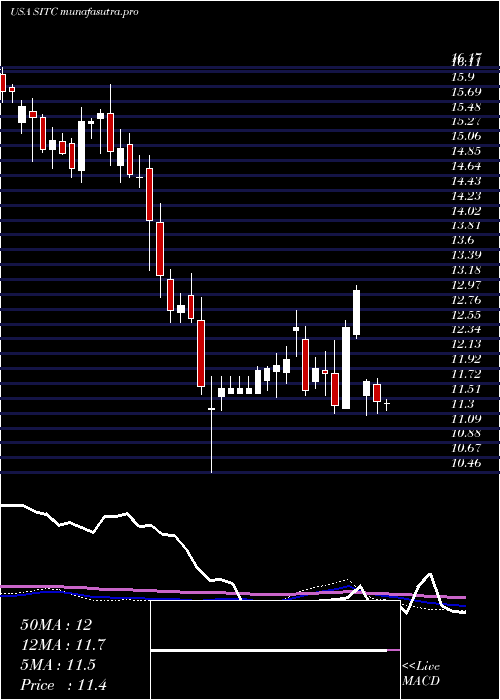
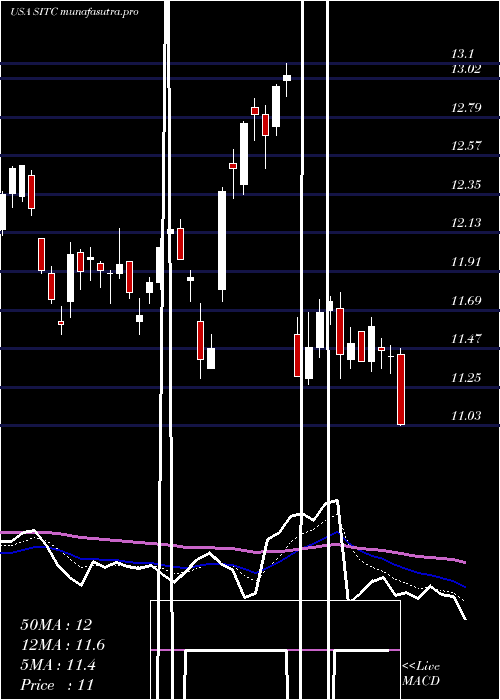
Monthly price and charts SiteCenters Strong monthly Stock price targets for SiteCenters SITC are 7.08 and 7.32 | Monthly Target 1 | 7.03 | | Monthly Target 2 | 7.12 | | Monthly Target 3 | 7.2666666666667 | | Monthly Target 4 | 7.36 | | Monthly Target 5 | 7.51 |
Monthly price and volumes Site Centers
| Date |
Closing |
Open |
Range |
Volume |
Thu 04 December 2025 |
7.22 (-1.9%) |
7.29 |
7.17 - 7.41 |
0.1451 times |
Fri 28 November 2025 |
7.36 (0.41%) |
7.28 |
6.76 - 7.49 |
1.0968 times |
Fri 31 October 2025 |
7.33 (-18.65%) |
9.00 |
7.28 - 9.08 |
1.0344 times |
Tue 30 September 2025 |
9.01 (-26.63%) |
8.96 |
8.58 - 9.55 |
1.4908 times |
Fri 29 August 2025 |
12.28 (14.02%) |
10.83 |
10.50 - 12.39 |
1.0467 times |
Thu 31 July 2025 |
10.77 (-4.77%) |
11.30 |
10.74 - 11.79 |
1.2165 times |
Mon 30 June 2025 |
11.31 (-5.12%) |
11.90 |
11.30 - 13.10 |
1.3429 times |
Fri 30 May 2025 |
11.92 (0.68%) |
11.90 |
11.55 - 12.74 |
0.6142 times |
Wed 30 April 2025 |
11.84 (-7.79%) |
12.76 |
10.46 - 12.92 |
0.8728 times |
Mon 31 March 2025 |
12.84 (-8.35%) |
13.98 |
12.47 - 14.25 |
1.1397 times |
Fri 28 February 2025 |
14.01 (-6.48%) |
14.79 |
13.30 - 15.29 |
0.7981 times |
DMA SMA EMA moving averages of Site Centers SITC
DMA (daily moving average) of Site Centers SITC
| DMA period | DMA value | | 5 day DMA | 7.28 | | 12 day DMA | 7.17 | | 20 day DMA | 7.14 | | 35 day DMA | 7.66 | | 50 day DMA | 7.99 | | 100 day DMA | 9.38 | | 150 day DMA | 10.26 | | 200 day DMA | 10.88 | EMA (exponential moving average) of Site Centers SITC
| EMA period | EMA current | EMA prev | EMA prev2 | | 5 day EMA | 7.25 | 7.27 | 7.27 | | 12 day EMA | 7.24 | 7.24 | 7.24 | | 20 day EMA | 7.33 | 7.34 | 7.35 | | 35 day EMA | 7.63 | 7.65 | 7.67 | | 50 day EMA | 7.99 | 8.02 | 8.05 |
SMA (simple moving average) of Site Centers SITC
| SMA period | SMA current | SMA prev | SMA prev2 | | 5 day SMA | 7.28 | 7.31 | 7.34 | | 12 day SMA | 7.17 | 7.14 | 7.11 | | 20 day SMA | 7.14 | 7.16 | 7.16 | | 35 day SMA | 7.66 | 7.7 | 7.74 | | 50 day SMA | 7.99 | 8.02 | 8.05 | | 100 day SMA | 9.38 | 9.43 | 9.47 | | 150 day SMA | 10.26 | 10.29 | 10.32 | | 200 day SMA | 10.88 | 10.92 | 10.96 |
|
|
