Silicom SILC full analysis,charts,indicators,moving averages,SMA,DMA,EMA,ADX,MACD,RSISilicom SILC WideScreen charts, DMA,SMA,EMA technical analysis, forecast prediction, by indicators ADX,MACD,RSI,CCI USA stock exchange
operates under Technology sector & deals in Computer Communications Equipment
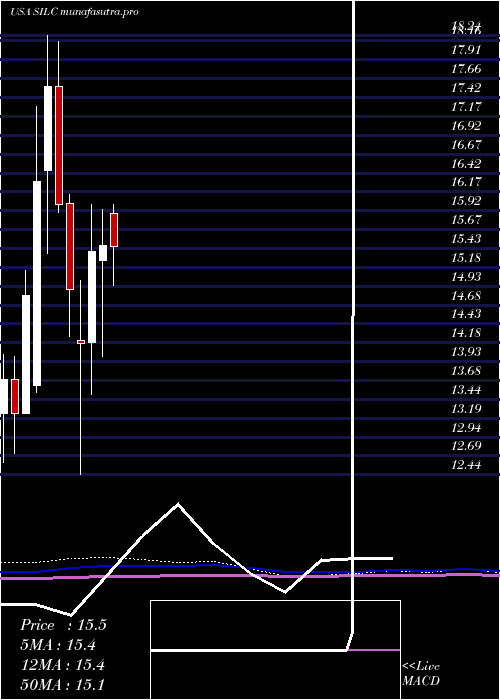
Daily price and charts and targets Silicom Strong Daily Stock price targets for Silicom SILC are 16.75 and 17.05 | Daily Target 1 | 16.7 | | Daily Target 2 | 16.8 | | Daily Target 3 | 17 | | Daily Target 4 | 17.1 | | Daily Target 5 | 17.3 |
Daily price and volume Silicom
| Date |
Closing |
Open |
Range |
Volume |
Tue 21 October 2025 |
16.90 (-1.74%) |
17.19 |
16.90 - 17.20 |
0.4525 times |
Mon 20 October 2025 |
17.20 (-0.58%) |
17.30 |
17.01 - 17.50 |
0.7886 times |
Fri 17 October 2025 |
17.30 (1.29%) |
16.72 |
16.67 - 17.37 |
0.905 times |
Thu 16 October 2025 |
17.08 (-2.9%) |
17.60 |
16.83 - 17.60 |
0.8791 times |
Wed 15 October 2025 |
17.59 (3.84%) |
17.49 |
17.23 - 17.80 |
0.905 times |
Tue 14 October 2025 |
16.94 (-1.68%) |
17.25 |
16.93 - 17.50 |
0.9179 times |
Mon 13 October 2025 |
17.23 (-3.26%) |
18.67 |
17.23 - 18.67 |
1.4609 times |
Fri 10 October 2025 |
17.81 (-2.14%) |
18.62 |
17.80 - 18.65 |
0.905 times |
Thu 09 October 2025 |
18.20 (3.35%) |
17.84 |
17.84 - 18.90 |
1.3122 times |
Wed 08 October 2025 |
17.61 (0.28%) |
17.50 |
17.44 - 18.00 |
1.4738 times |
Tue 07 October 2025 |
17.56 (-0.51%) |
17.46 |
17.37 - 17.64 |
1.6613 times |
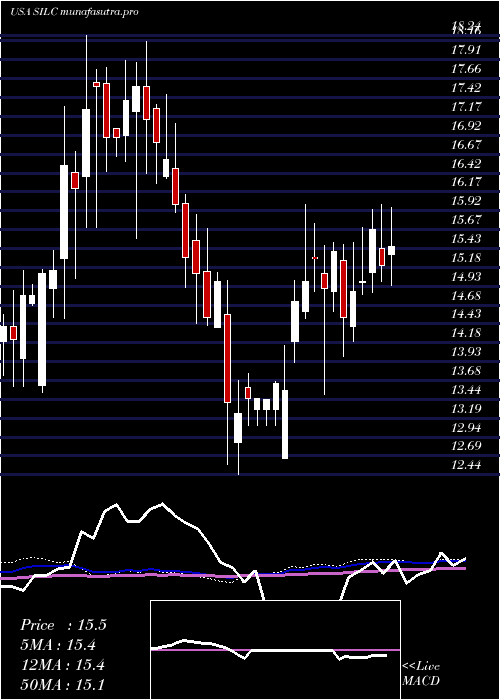
Weekly price and charts Silicom Strong weekly Stock price targets for Silicom SILC are 16.6 and 17.2 | Weekly Target 1 | 16.5 | | Weekly Target 2 | 16.7 | | Weekly Target 3 | 17.1 | | Weekly Target 4 | 17.3 | | Weekly Target 5 | 17.7 |
Weekly price and volumes for Silicom
| Date |
Closing |
Open |
Range |
Volume |
Tue 21 October 2025 |
16.90 (-2.31%) |
17.30 |
16.90 - 17.50 |
0.2672 times |
Fri 17 October 2025 |
17.30 (-2.86%) |
18.67 |
16.67 - 18.67 |
1.0909 times |
Fri 10 October 2025 |
17.81 (2.24%) |
17.46 |
17.37 - 18.90 |
1.4221 times |
Fri 03 October 2025 |
17.42 (0.75%) |
17.54 |
17.01 - 18.25 |
1.9895 times |
Fri 26 September 2025 |
17.29 (2.19%) |
16.99 |
16.94 - 18.32 |
1.23 times |
Fri 19 September 2025 |
16.92 (-7.54%) |
18.50 |
16.92 - 18.96 |
1.724 times |
Fri 12 September 2025 |
18.30 (8.93%) |
16.84 |
16.84 - 19.36 |
1.2509 times |
Fri 05 September 2025 |
16.80 (2.19%) |
16.40 |
15.84 - 17.00 |
0.327 times |
Fri 29 August 2025 |
16.44 (0%) |
16.50 |
16.40 - 16.67 |
0.0306 times |
Fri 29 August 2025 |
16.44 (6.13%) |
15.67 |
15.40 - 16.88 |
0.6679 times |
Fri 22 August 2025 |
15.49 (-3.19%) |
15.95 |
15.03 - 16.49 |
1.0839 times |
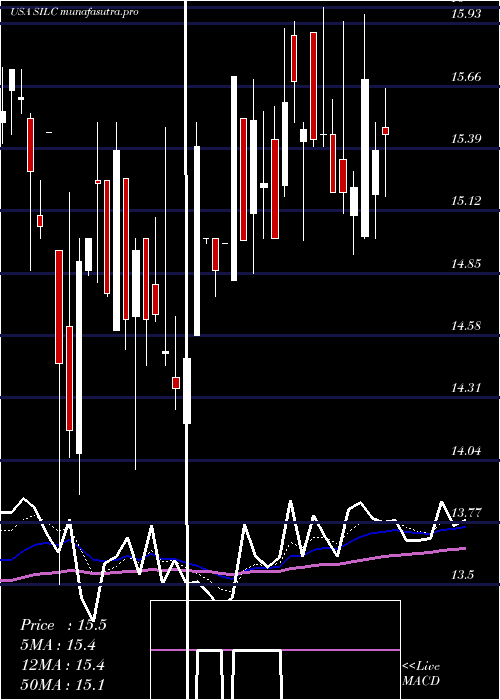
Monthly price and charts Silicom Strong monthly Stock price targets for Silicom SILC are 15.67 and 17.9 | Monthly Target 1 | 15.26 | | Monthly Target 2 | 16.08 | | Monthly Target 3 | 17.49 | | Monthly Target 4 | 18.31 | | Monthly Target 5 | 19.72 |
Monthly price and volumes Silicom
| Date |
Closing |
Open |
Range |
Volume |
Tue 21 October 2025 |
16.90 (-4.63%) |
17.99 |
16.67 - 18.90 |
0.829 times |
Tue 30 September 2025 |
17.72 (7.79%) |
16.40 |
15.84 - 19.36 |
0.9739 times |
Fri 29 August 2025 |
16.44 (-0.36%) |
16.26 |
15.03 - 18.19 |
0.972 times |
Thu 31 July 2025 |
16.50 (6.66%) |
15.89 |
14.93 - 18.61 |
0.9146 times |
Mon 30 June 2025 |
15.47 (0.59%) |
15.26 |
14.00 - 15.94 |
0.633 times |
Fri 30 May 2025 |
15.38 (8.54%) |
14.19 |
13.50 - 16.00 |
0.8156 times |
Wed 30 April 2025 |
14.17 (-4.77%) |
14.21 |
12.44 - 15.00 |
0.9612 times |
Mon 31 March 2025 |
14.88 (-7%) |
16.02 |
14.27 - 16.13 |
1.2482 times |
Fri 28 February 2025 |
16.00 (-8.88%) |
17.56 |
15.90 - 18.15 |
0.7093 times |
Fri 31 January 2025 |
17.56 (7.66%) |
16.45 |
15.36 - 18.24 |
1.9429 times |
Tue 31 December 2024 |
16.31 (10.2%) |
13.62 |
13.52 - 17.30 |
2.1359 times |
DMA SMA EMA moving averages of Silicom SILC
DMA (daily moving average) of Silicom SILC
| DMA period | DMA value | | 5 day DMA | 17.21 | | 12 day DMA | 17.42 | | 20 day DMA | 17.44 | | 35 day DMA | 17.51 | | 50 day DMA | 17.04 | | 100 day DMA | 16.27 | | 150 day DMA | 15.64 | | 200 day DMA | 15.9 | EMA (exponential moving average) of Silicom SILC
| EMA period | EMA current | EMA prev | EMA prev2 | | 5 day EMA | 17.15 | 17.28 | 17.32 | | 12 day EMA | 17.31 | 17.39 | 17.42 | | 20 day EMA | 17.35 | 17.4 | 17.42 | | 35 day EMA | 17.19 | 17.21 | 17.21 | | 50 day EMA | 17 | 17 | 16.99 |
SMA (simple moving average) of Silicom SILC
| SMA period | SMA current | SMA prev | SMA prev2 | | 5 day SMA | 17.21 | 17.22 | 17.23 | | 12 day SMA | 17.42 | 17.47 | 17.47 | | 20 day SMA | 17.44 | 17.48 | 17.5 | | 35 day SMA | 17.51 | 17.49 | 17.47 | | 50 day SMA | 17.04 | 17.02 | 17 | | 100 day SMA | 16.27 | 16.25 | 16.23 | | 150 day SMA | 15.64 | 15.63 | 15.62 | | 200 day SMA | 15.9 | 15.89 | 15.89 |
|
|
