SelectiveInsurance SIGI full analysis,charts,indicators,moving averages,SMA,DMA,EMA,ADX,MACD,RSISelective Insurance SIGI WideScreen charts, DMA,SMA,EMA technical analysis, forecast prediction, by indicators ADX,MACD,RSI,CCI USA stock exchange
operates under Finance sector & deals in Property Casualty Insurers
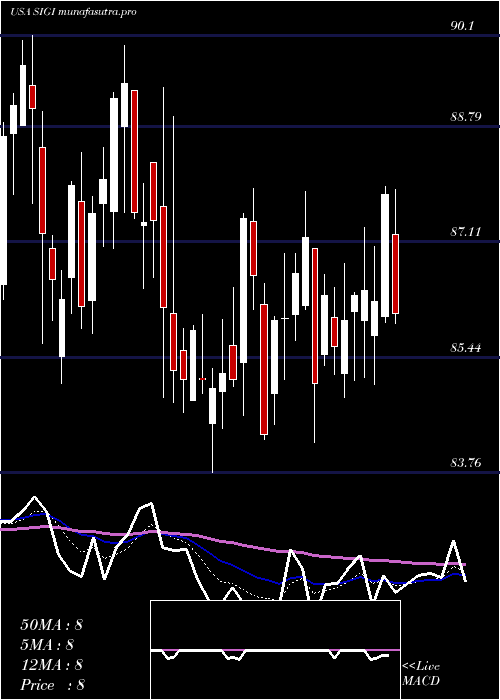
Daily price and charts and targets SelectiveInsurance Strong Daily Stock price targets for SelectiveInsurance SIGI are 82.48 and 84.79 | Daily Target 1 | 80.57 | | Daily Target 2 | 82.08 | | Daily Target 3 | 82.876666666667 | | Daily Target 4 | 84.39 | | Daily Target 5 | 85.19 |
Daily price and volume Selective Insurance
| Date |
Closing |
Open |
Range |
Volume |
Mon 20 October 2025 |
83.60 (3.02%) |
81.84 |
81.36 - 83.67 |
1.0512 times |
Fri 17 October 2025 |
81.15 (0.73%) |
80.56 |
80.32 - 81.47 |
0.778 times |
Thu 16 October 2025 |
80.56 (-2.78%) |
82.38 |
80.47 - 83.33 |
0.7773 times |
Wed 15 October 2025 |
82.86 (-1.68%) |
83.98 |
82.01 - 84.26 |
0.6685 times |
Tue 14 October 2025 |
84.28 (2.24%) |
82.51 |
82.26 - 84.56 |
1.1315 times |
Mon 13 October 2025 |
82.43 (0.79%) |
81.80 |
80.85 - 82.68 |
0.9036 times |
Fri 10 October 2025 |
81.78 (-1.37%) |
83.75 |
81.60 - 83.75 |
1.1392 times |
Thu 09 October 2025 |
82.92 (-1.59%) |
84.10 |
82.59 - 84.65 |
0.8678 times |
Wed 08 October 2025 |
84.26 (0.02%) |
84.54 |
83.93 - 84.85 |
0.8519 times |
Tue 07 October 2025 |
84.24 (0.05%) |
84.31 |
82.95 - 85.06 |
1.831 times |
Mon 06 October 2025 |
84.20 (0.83%) |
83.92 |
83.65 - 84.86 |
1.0265 times |
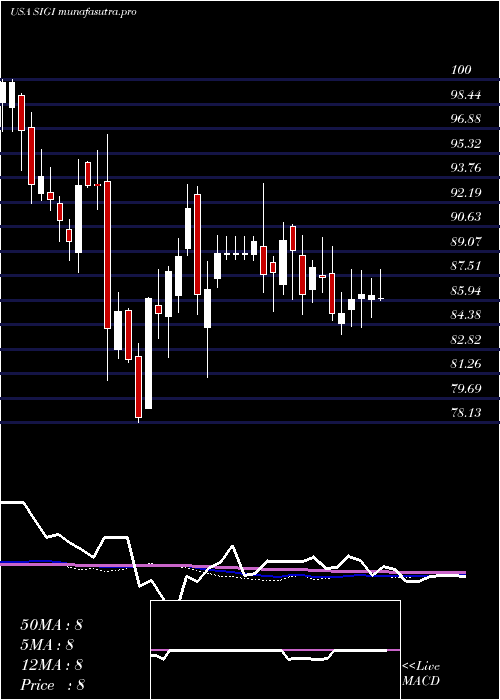
Weekly price and charts SelectiveInsurance Strong weekly Stock price targets for SelectiveInsurance SIGI are 82.48 and 84.79 | Weekly Target 1 | 80.57 | | Weekly Target 2 | 82.08 | | Weekly Target 3 | 82.876666666667 | | Weekly Target 4 | 84.39 | | Weekly Target 5 | 85.19 |
Weekly price and volumes for Selective Insurance
| Date |
Closing |
Open |
Range |
Volume |
Mon 20 October 2025 |
83.60 (3.02%) |
81.84 |
81.36 - 83.67 |
0.227 times |
Fri 17 October 2025 |
81.15 (-0.77%) |
81.80 |
80.32 - 84.56 |
0.9198 times |
Fri 10 October 2025 |
81.78 (-2.07%) |
83.92 |
81.60 - 85.06 |
1.2346 times |
Fri 03 October 2025 |
83.51 (4.6%) |
79.78 |
78.82 - 83.97 |
0.8538 times |
Fri 26 September 2025 |
79.84 (3.11%) |
77.08 |
76.44 - 80.05 |
1.0523 times |
Fri 19 September 2025 |
77.43 (-2%) |
79.24 |
76.10 - 79.40 |
1.9885 times |
Fri 12 September 2025 |
79.01 (-1%) |
79.87 |
77.09 - 79.89 |
0.9664 times |
Fri 05 September 2025 |
79.81 (2.02%) |
78.13 |
77.63 - 81.10 |
0.726 times |
Fri 29 August 2025 |
78.23 (0%) |
78.49 |
78.17 - 79.43 |
0.3141 times |
Fri 29 August 2025 |
78.23 (-0.61%) |
78.50 |
77.24 - 79.48 |
1.7173 times |
Fri 22 August 2025 |
78.71 (2.61%) |
76.54 |
75.73 - 79.37 |
1.1591 times |
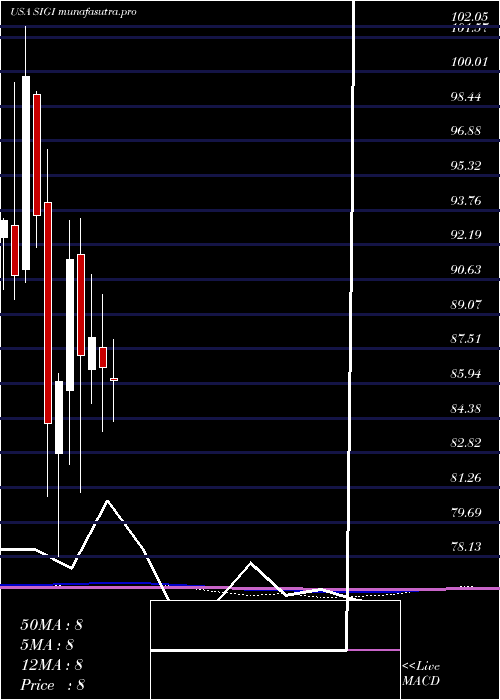
Monthly price and charts SelectiveInsurance Strong monthly Stock price targets for SelectiveInsurance SIGI are 81.82 and 86.85 | Monthly Target 1 | 77.87 | | Monthly Target 2 | 80.73 | | Monthly Target 3 | 82.896666666667 | | Monthly Target 4 | 85.76 | | Monthly Target 5 | 87.93 |
Monthly price and volumes Selective Insurance
| Date |
Closing |
Open |
Range |
Volume |
Mon 20 October 2025 |
83.60 (3.12%) |
80.33 |
80.03 - 85.06 |
0.6352 times |
Tue 30 September 2025 |
81.07 (3.63%) |
78.13 |
76.10 - 81.28 |
1.1478 times |
Fri 29 August 2025 |
78.23 (0.33%) |
78.30 |
75.73 - 79.48 |
1.2936 times |
Thu 31 July 2025 |
77.97 (-10.02%) |
86.18 |
71.75 - 91.63 |
1.6564 times |
Mon 30 June 2025 |
86.65 (-1.56%) |
87.55 |
83.76 - 89.96 |
0.7563 times |
Fri 30 May 2025 |
88.02 (0.91%) |
86.58 |
85.06 - 90.87 |
0.8909 times |
Wed 30 April 2025 |
87.23 (-4.71%) |
91.75 |
81.02 - 93.38 |
0.9192 times |
Mon 31 March 2025 |
91.54 (6.38%) |
85.61 |
82.28 - 93.30 |
0.7567 times |
Fri 28 February 2025 |
86.05 (2.28%) |
82.79 |
78.13 - 86.41 |
1.0094 times |
Fri 31 January 2025 |
84.13 (-10.04%) |
94.10 |
80.84 - 96.49 |
0.9345 times |
Tue 31 December 2024 |
93.52 (-6.29%) |
98.97 |
92.08 - 99.11 |
0.4844 times |
DMA SMA EMA moving averages of Selective Insurance SIGI
DMA (daily moving average) of Selective Insurance SIGI
| DMA period | DMA value | | 5 day DMA | 82.49 | | 12 day DMA | 82.98 | | 20 day DMA | 81.75 | | 35 day DMA | 80.42 | | 50 day DMA | 79.68 | | 100 day DMA | 82.22 | | 150 day DMA | 84.33 | | 200 day DMA | 85.05 | EMA (exponential moving average) of Selective Insurance SIGI
| EMA period | EMA current | EMA prev | EMA prev2 | | 5 day EMA | 82.45 | 81.88 | 82.25 | | 12 day EMA | 82.28 | 82.04 | 82.2 | | 20 day EMA | 81.74 | 81.54 | 81.58 | | 35 day EMA | 80.88 | 80.72 | 80.69 | | 50 day EMA | 79.82 | 79.67 | 79.61 |
SMA (simple moving average) of Selective Insurance SIGI
| SMA period | SMA current | SMA prev | SMA prev2 | | 5 day SMA | 82.49 | 82.26 | 82.38 | | 12 day SMA | 82.98 | 82.87 | 82.88 | | 20 day SMA | 81.75 | 81.51 | 81.32 | | 35 day SMA | 80.42 | 80.26 | 80.18 | | 50 day SMA | 79.68 | 79.56 | 79.5 | | 100 day SMA | 82.22 | 82.26 | 82.31 | | 150 day SMA | 84.33 | 84.36 | 84.39 | | 200 day SMA | 85.05 | 85.09 | 85.15 |
|
|
