SifyTechnologies SIFY full analysis,charts,indicators,moving averages,SMA,DMA,EMA,ADX,MACD,RSISify Technologies SIFY WideScreen charts, DMA,SMA,EMA technical analysis, forecast prediction, by indicators ADX,MACD,RSI,CCI USA stock exchange
operates under Technology sector & deals in Computer Software Programming Data Processing
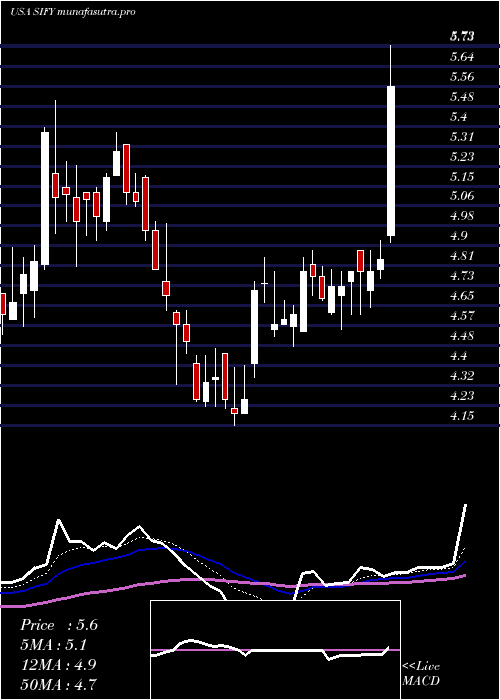
Daily price and charts and targets SifyTechnologies Strong Daily Stock price targets for SifyTechnologies SIFY are 11.67 and 12.36 | Daily Target 1 | 11.17 | | Daily Target 2 | 11.48 | | Daily Target 3 | 11.86 | | Daily Target 4 | 12.17 | | Daily Target 5 | 12.55 |
Daily price and volume Sify Technologies
| Date |
Closing |
Open |
Range |
Volume |
Thu 04 December 2025 |
11.79 (1.81%) |
11.66 |
11.55 - 12.24 |
0.9775 times |
Wed 03 December 2025 |
11.58 (-0.86%) |
11.75 |
11.40 - 11.80 |
0.4502 times |
Tue 02 December 2025 |
11.68 (4.1%) |
11.37 |
11.22 - 11.91 |
1.2678 times |
Mon 01 December 2025 |
11.22 (1.36%) |
11.07 |
11.07 - 11.47 |
1.1539 times |
Fri 28 November 2025 |
11.07 (1.65%) |
10.93 |
10.93 - 11.23 |
0.6817 times |
Wed 26 November 2025 |
10.89 (-0.27%) |
11.00 |
10.86 - 11.26 |
0.5806 times |
Tue 25 November 2025 |
10.92 (-3.96%) |
11.37 |
10.87 - 11.37 |
0.3517 times |
Mon 24 November 2025 |
11.37 (9.64%) |
10.51 |
10.51 - 11.48 |
1.2109 times |
Fri 21 November 2025 |
10.37 (-3.45%) |
10.96 |
10.09 - 11.00 |
1.9458 times |
Thu 20 November 2025 |
10.74 (-5.79%) |
11.40 |
10.63 - 11.90 |
1.3799 times |
Wed 19 November 2025 |
11.40 (-5.47%) |
12.11 |
11.00 - 12.25 |
1.1576 times |
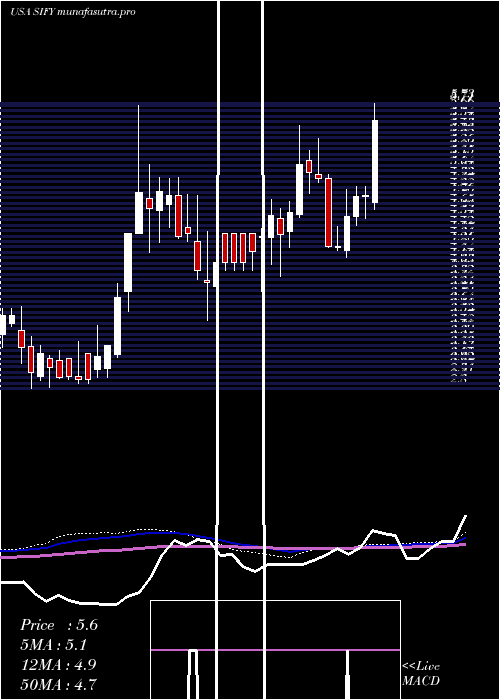
Weekly price and charts SifyTechnologies Strong weekly Stock price targets for SifyTechnologies SIFY are 11.43 and 12.6 | Weekly Target 1 | 10.53 | | Weekly Target 2 | 11.16 | | Weekly Target 3 | 11.7 | | Weekly Target 4 | 12.33 | | Weekly Target 5 | 12.87 |
Weekly price and volumes for Sify Technologies
| Date |
Closing |
Open |
Range |
Volume |
Thu 04 December 2025 |
11.79 (6.5%) |
11.07 |
11.07 - 12.24 |
0.2667 times |
Fri 28 November 2025 |
11.07 (6.75%) |
10.51 |
10.51 - 11.48 |
0.1957 times |
Fri 21 November 2025 |
10.37 (-2.72%) |
10.57 |
10.09 - 12.25 |
0.5284 times |
Fri 14 November 2025 |
10.66 (-1.2%) |
10.79 |
10.53 - 11.94 |
0.4425 times |
Fri 07 November 2025 |
10.79 (-7.22%) |
11.19 |
10.41 - 11.70 |
0.4887 times |
Fri 31 October 2025 |
11.63 (0%) |
11.55 |
11.52 - 12.19 |
0.0807 times |
Fri 31 October 2025 |
11.63 (-5.68%) |
12.38 |
10.57 - 13.10 |
1.81 times |
Fri 24 October 2025 |
12.33 (-7.57%) |
13.58 |
12.00 - 13.87 |
0.9905 times |
Fri 17 October 2025 |
13.34 (-19.15%) |
16.61 |
11.00 - 17.85 |
3.7213 times |
Fri 10 October 2025 |
16.50 (24.72%) |
13.23 |
13.21 - 17.37 |
1.4755 times |
Fri 03 October 2025 |
13.23 (2.64%) |
13.16 |
12.50 - 14.10 |
0.7054 times |
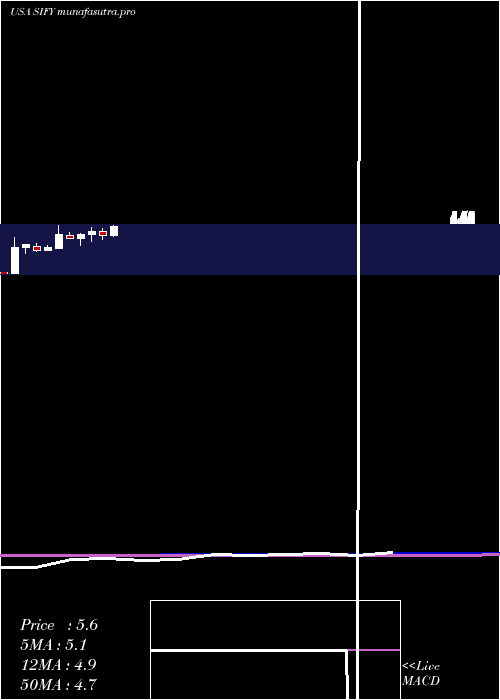
Monthly price and charts SifyTechnologies Strong monthly Stock price targets for SifyTechnologies SIFY are 11.43 and 12.6 | Monthly Target 1 | 10.53 | | Monthly Target 2 | 11.16 | | Monthly Target 3 | 11.7 | | Monthly Target 4 | 12.33 | | Monthly Target 5 | 12.87 |
Monthly price and volumes Sify Technologies
| Date |
Closing |
Open |
Range |
Volume |
Thu 04 December 2025 |
11.79 (6.5%) |
11.07 |
11.07 - 12.24 |
0.0991 times |
Fri 28 November 2025 |
11.07 (-4.82%) |
11.19 |
10.09 - 12.25 |
0.6149 times |
Fri 31 October 2025 |
11.63 (-14.86%) |
13.56 |
10.57 - 17.85 |
3.1032 times |
Tue 30 September 2025 |
13.66 (44.86%) |
9.35 |
8.90 - 14.10 |
1.5687 times |
Fri 29 August 2025 |
9.43 (41.17%) |
6.77 |
6.51 - 9.79 |
1.7163 times |
Thu 31 July 2025 |
6.68 (45.53%) |
4.56 |
4.48 - 7.10 |
0.9345 times |
Mon 30 June 2025 |
4.59 (-8.57%) |
5.00 |
4.15 - 5.37 |
0.4133 times |
Fri 30 May 2025 |
5.02 (7.96%) |
4.74 |
3.95 - 5.50 |
0.5704 times |
Wed 30 April 2025 |
4.65 (8.64%) |
4.21 |
3.50 - 4.79 |
0.4903 times |
Mon 31 March 2025 |
4.28 (-7.96%) |
4.63 |
4.20 - 4.97 |
0.4893 times |
Fri 28 February 2025 |
4.65 (43.52%) |
3.15 |
3.12 - 5.71 |
1.6266 times |
DMA SMA EMA moving averages of Sify Technologies SIFY
DMA (daily moving average) of Sify Technologies SIFY
| DMA period | DMA value | | 5 day DMA | 11.47 | | 12 day DMA | 11.26 | | 20 day DMA | 11.19 | | 35 day DMA | 11.58 | | 50 day DMA | 12.45 | | 100 day DMA | 10.68 | | 150 day DMA | 8.69 | | 200 day DMA | 7.63 | EMA (exponential moving average) of Sify Technologies SIFY
| EMA period | EMA current | EMA prev | EMA prev2 | | 5 day EMA | 11.52 | 11.38 | 11.28 | | 12 day EMA | 11.36 | 11.28 | 11.22 | | 20 day EMA | 11.41 | 11.37 | 11.35 | | 35 day EMA | 11.83 | 11.83 | 11.85 | | 50 day EMA | 12.32 | 12.34 | 12.37 |
SMA (simple moving average) of Sify Technologies SIFY
| SMA period | SMA current | SMA prev | SMA prev2 | | 5 day SMA | 11.47 | 11.29 | 11.16 | | 12 day SMA | 11.26 | 11.21 | 11.14 | | 20 day SMA | 11.19 | 11.17 | 11.13 | | 35 day SMA | 11.58 | 11.65 | 11.81 | | 50 day SMA | 12.45 | 12.46 | 12.46 | | 100 day SMA | 10.68 | 10.61 | 10.55 | | 150 day SMA | 8.69 | 8.64 | 8.59 | | 200 day SMA | 7.63 | 7.59 | 7.55 |
|
|
