SiebertFinancial SIEB full analysis,charts,indicators,moving averages,SMA,DMA,EMA,ADX,MACD,RSISiebert Financial SIEB WideScreen charts, DMA,SMA,EMA technical analysis, forecast prediction, by indicators ADX,MACD,RSI,CCI USA stock exchange
operates under Finance sector & deals in Investment Bankers Brokers Service
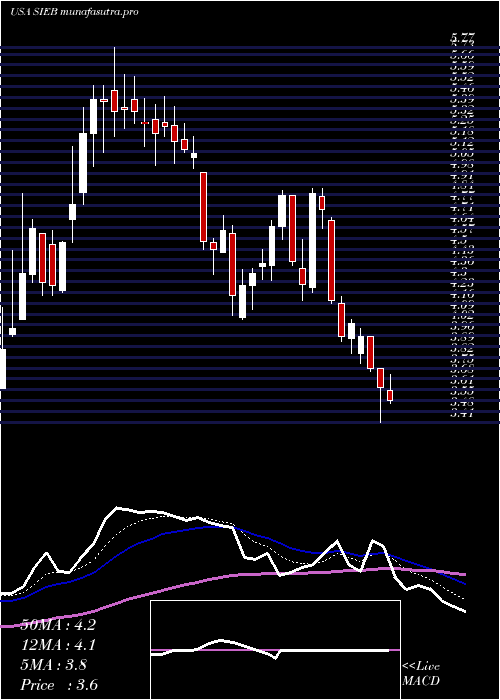
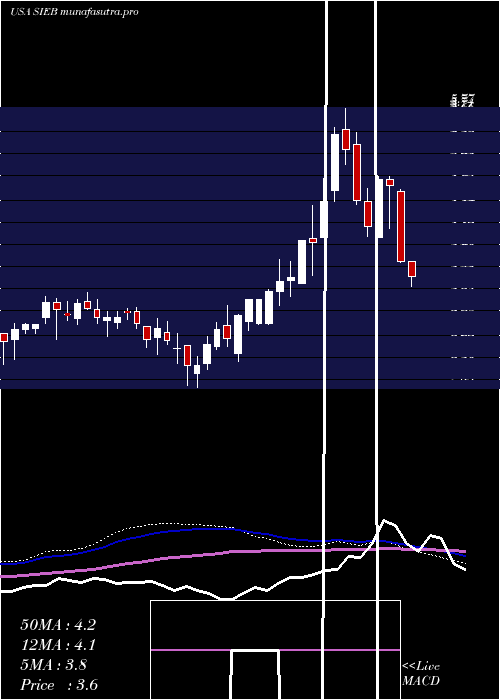
Daily price and charts and targets SiebertFinancial Strong Daily Stock price targets for SiebertFinancial SIEB are 3.22 and 3.3 | Daily Target 1 | 3.15 | | Daily Target 2 | 3.21 | | Daily Target 3 | 3.2333333333333 | | Daily Target 4 | 3.29 | | Daily Target 5 | 3.31 |
Daily price and volume Siebert Financial
| Date |
Closing |
Open |
Range |
Volume |
Mon 20 October 2025 |
3.26 (4.49%) |
3.19 |
3.18 - 3.26 |
0.4798 times |
Fri 17 October 2025 |
3.12 (-0.32%) |
3.10 |
3.03 - 3.16 |
0.7239 times |
Thu 16 October 2025 |
3.13 (-2.49%) |
3.21 |
3.12 - 3.23 |
0.5303 times |
Wed 15 October 2025 |
3.21 (0%) |
3.23 |
3.14 - 3.31 |
0.8221 times |
Tue 14 October 2025 |
3.21 (4.56%) |
3.07 |
3.03 - 3.21 |
1.0578 times |
Mon 13 October 2025 |
3.07 (0.66%) |
3.04 |
3.01 - 3.13 |
0.376 times |
Fri 10 October 2025 |
3.05 (-1.93%) |
3.12 |
3.05 - 3.17 |
1.2935 times |
Thu 09 October 2025 |
3.11 (-7.44%) |
3.37 |
3.08 - 3.37 |
0.9596 times |
Wed 08 October 2025 |
3.36 (14.29%) |
2.94 |
2.94 - 3.38 |
2.6235 times |
Tue 07 October 2025 |
2.94 (2.44%) |
2.87 |
2.84 - 2.96 |
1.1336 times |
Mon 06 October 2025 |
2.87 (-2.05%) |
2.94 |
2.85 - 2.96 |
1.1841 times |
Weekly price and charts SiebertFinancial Strong weekly Stock price targets for SiebertFinancial SIEB are 3.22 and 3.3 | Weekly Target 1 | 3.15 | | Weekly Target 2 | 3.21 | | Weekly Target 3 | 3.2333333333333 | | Weekly Target 4 | 3.29 | | Weekly Target 5 | 3.31 |
Weekly price and volumes for Siebert Financial
| Date |
Closing |
Open |
Range |
Volume |
Mon 20 October 2025 |
3.26 (4.49%) |
3.19 |
3.18 - 3.26 |
0.0884 times |
Fri 17 October 2025 |
3.12 (2.3%) |
3.04 |
3.01 - 3.31 |
0.647 times |
Fri 10 October 2025 |
3.05 (4.1%) |
2.94 |
2.84 - 3.38 |
1.326 times |
Fri 03 October 2025 |
2.93 (0.34%) |
2.94 |
2.82 - 2.98 |
0.5095 times |
Fri 26 September 2025 |
2.92 (0%) |
2.86 |
2.80 - 2.99 |
0.6578 times |
Fri 19 September 2025 |
2.92 (-0.34%) |
2.91 |
2.81 - 3.24 |
2.0961 times |
Fri 12 September 2025 |
2.93 (16.73%) |
2.52 |
2.48 - 2.94 |
1.4739 times |
Fri 05 September 2025 |
2.51 (-8.06%) |
2.69 |
2.42 - 2.73 |
1.1988 times |
Fri 29 August 2025 |
2.73 (0%) |
2.75 |
2.66 - 2.83 |
0.3418 times |
Fri 29 August 2025 |
2.73 (-11.07%) |
3.01 |
2.66 - 3.04 |
1.6606 times |
Fri 22 August 2025 |
3.07 (-18.35%) |
3.62 |
2.81 - 3.65 |
2.334 times |
Monthly price and charts SiebertFinancial Strong monthly Stock price targets for SiebertFinancial SIEB are 3.04 and 3.6 | Monthly Target 1 | 2.59 | | Monthly Target 2 | 2.93 | | Monthly Target 3 | 3.1533333333333 | | Monthly Target 4 | 3.49 | | Monthly Target 5 | 3.71 |
Monthly price and volumes Siebert Financial
| Date |
Closing |
Open |
Range |
Volume |
Mon 20 October 2025 |
3.26 (11.64%) |
2.93 |
2.82 - 3.38 |
0.3131 times |
Tue 30 September 2025 |
2.92 (6.96%) |
2.69 |
2.42 - 3.24 |
0.7455 times |
Fri 29 August 2025 |
2.73 (-32.92%) |
4.03 |
2.66 - 4.15 |
0.9558 times |
Thu 31 July 2025 |
4.07 (-7.92%) |
4.38 |
3.41 - 4.88 |
1.3971 times |
Mon 30 June 2025 |
4.42 (-18.6%) |
5.50 |
4.06 - 5.77 |
3.3146 times |
Fri 30 May 2025 |
5.43 (58.31%) |
3.50 |
3.40 - 5.53 |
1.9476 times |
Wed 30 April 2025 |
3.43 (13.95%) |
3.05 |
2.42 - 3.77 |
0.6931 times |
Mon 31 March 2025 |
3.01 (15.77%) |
2.64 |
2.08 - 3.16 |
0.2147 times |
Fri 28 February 2025 |
2.60 (-11.26%) |
2.88 |
2.40 - 2.99 |
0.1959 times |
Fri 31 January 2025 |
2.93 (-7.28%) |
3.08 |
2.76 - 3.34 |
0.2226 times |
Tue 31 December 2024 |
3.16 (8.59%) |
3.00 |
2.72 - 3.29 |
0.4034 times |
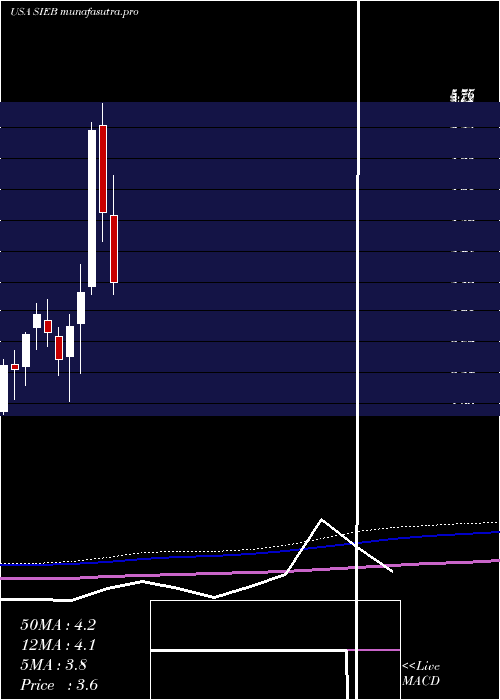
DMA SMA EMA moving averages of Siebert Financial SIEB
DMA (daily moving average) of Siebert Financial SIEB
| DMA period | DMA value | | 5 day DMA | 3.19 | | 12 day DMA | 3.11 | | 20 day DMA | 3.02 | | 35 day DMA | 2.93 | | 50 day DMA | 3 | | 100 day DMA | 3.71 | | 150 day DMA | 3.59 | | 200 day DMA | 3.39 | EMA (exponential moving average) of Siebert Financial SIEB
| EMA period | EMA current | EMA prev | EMA prev2 | | 5 day EMA | 3.17 | 3.13 | 3.14 | | 12 day EMA | 3.12 | 3.09 | 3.08 | | 20 day EMA | 3.08 | 3.06 | 3.05 | | 35 day EMA | 3.06 | 3.05 | 3.05 | | 50 day EMA | 3.1 | 3.09 | 3.09 |
SMA (simple moving average) of Siebert Financial SIEB
| SMA period | SMA current | SMA prev | SMA prev2 | | 5 day SMA | 3.19 | 3.15 | 3.13 | | 12 day SMA | 3.11 | 3.07 | 3.05 | | 20 day SMA | 3.02 | 3 | 2.99 | | 35 day SMA | 2.93 | 2.91 | 2.9 | | 50 day SMA | 3 | 3.01 | 3.03 | | 100 day SMA | 3.71 | 3.72 | 3.73 | | 150 day SMA | 3.59 | 3.58 | 3.58 | | 200 day SMA | 3.39 | 3.39 | 3.39 |
|
|
