NationalSteel SID full analysis,charts,indicators,moving averages,SMA,DMA,EMA,ADX,MACD,RSINational Steel SID WideScreen charts, DMA,SMA,EMA technical analysis, forecast prediction, by indicators ADX,MACD,RSI,CCI USA stock exchange
operates under Capital Goods sector & deals in Steel Iron Ore
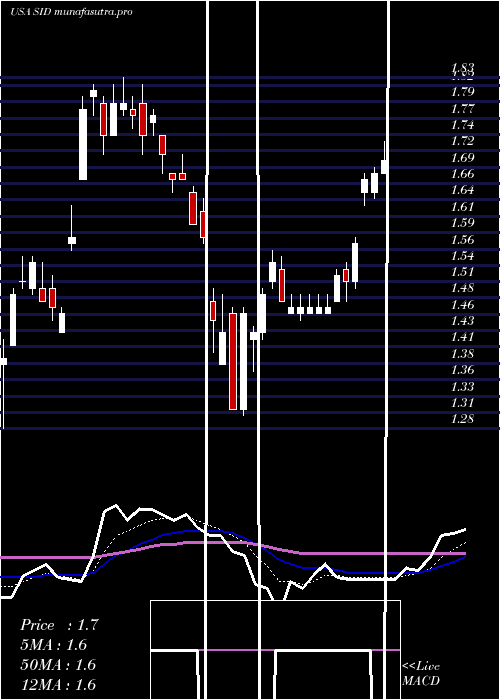
Daily price and charts and targets NationalSteel Strong Daily Stock price targets for NationalSteel SID are 1.62 and 1.67 | Daily Target 1 | 1.58 | | Daily Target 2 | 1.6 | | Daily Target 3 | 1.6266666666667 | | Daily Target 4 | 1.65 | | Daily Target 5 | 1.68 |
Daily price and volume National Steel
| Date |
Closing |
Open |
Range |
Volume |
Tue 21 October 2025 |
1.63 (-1.21%) |
1.61 |
1.60 - 1.65 |
0.944 times |
Mon 20 October 2025 |
1.65 (5.77%) |
1.57 |
1.57 - 1.67 |
1.4285 times |
Fri 17 October 2025 |
1.56 (2.63%) |
1.50 |
1.49 - 1.57 |
0.9149 times |
Thu 16 October 2025 |
1.52 (-1.94%) |
1.55 |
1.50 - 1.57 |
1.1446 times |
Wed 15 October 2025 |
1.55 (0.65%) |
1.53 |
1.52 - 1.57 |
0.7147 times |
Tue 14 October 2025 |
1.54 (0%) |
1.51 |
1.51 - 1.56 |
0.4965 times |
Mon 13 October 2025 |
1.54 (-3.75%) |
1.51 |
1.49 - 1.55 |
1.0153 times |
Tue 07 October 2025 |
1.60 (-3.61%) |
1.63 |
1.59 - 1.65 |
0.9112 times |
Mon 06 October 2025 |
1.66 (5.73%) |
1.59 |
1.55 - 1.67 |
1.967 times |
Fri 03 October 2025 |
1.57 (1.95%) |
1.53 |
1.53 - 1.57 |
0.4631 times |
Thu 02 October 2025 |
1.54 (0%) |
1.56 |
1.49 - 1.56 |
0.5739 times |
Weekly price and charts NationalSteel Strong weekly Stock price targets for NationalSteel SID are 1.6 and 1.7 | Weekly Target 1 | 1.52 | | Weekly Target 2 | 1.58 | | Weekly Target 3 | 1.6233333333333 | | Weekly Target 4 | 1.68 | | Weekly Target 5 | 1.72 |
Weekly price and volumes for National Steel
| Date |
Closing |
Open |
Range |
Volume |
Tue 21 October 2025 |
1.63 (4.49%) |
1.57 |
1.57 - 1.67 |
0.922 times |
Fri 17 October 2025 |
1.56 (-2.5%) |
1.51 |
1.49 - 1.57 |
1.6657 times |
Tue 07 October 2025 |
1.60 (1.91%) |
1.59 |
1.55 - 1.67 |
1.1185 times |
Fri 03 October 2025 |
1.57 (3.97%) |
1.53 |
1.49 - 1.58 |
1.1513 times |
Fri 26 September 2025 |
1.51 (0.67%) |
1.48 |
1.46 - 1.55 |
0.9703 times |
Fri 19 September 2025 |
1.50 (1.35%) |
1.48 |
1.47 - 1.59 |
1.3334 times |
Fri 12 September 2025 |
1.48 (1.37%) |
1.48 |
1.43 - 1.52 |
0.616 times |
Fri 05 September 2025 |
1.46 (3.55%) |
1.38 |
1.36 - 1.49 |
0.6683 times |
Fri 29 August 2025 |
1.41 (0%) |
1.45 |
1.41 - 1.47 |
0.283 times |
Fri 29 August 2025 |
1.41 (6.02%) |
1.34 |
1.33 - 1.47 |
1.2716 times |
Fri 22 August 2025 |
1.33 (3.91%) |
1.31 |
1.24 - 1.35 |
1.9421 times |
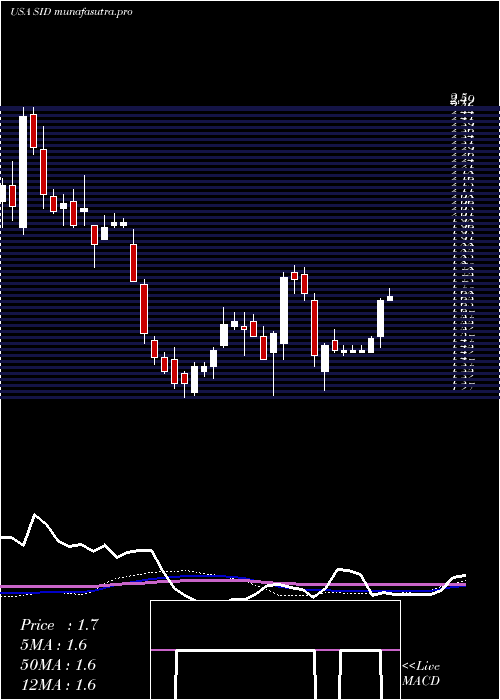
Monthly price and charts NationalSteel Strong monthly Stock price targets for NationalSteel SID are 1.56 and 1.74 | Monthly Target 1 | 1.42 | | Monthly Target 2 | 1.52 | | Monthly Target 3 | 1.5966666666667 | | Monthly Target 4 | 1.7 | | Monthly Target 5 | 1.78 |
Monthly price and volumes National Steel
| Date |
Closing |
Open |
Range |
Volume |
Tue 21 October 2025 |
1.63 (8.67%) |
1.52 |
1.49 - 1.67 |
0.7103 times |
Tue 30 September 2025 |
1.50 (6.38%) |
1.38 |
1.36 - 1.59 |
0.6647 times |
Fri 29 August 2025 |
1.41 (-2.76%) |
1.44 |
1.24 - 1.47 |
1.1927 times |
Thu 31 July 2025 |
1.45 (3.57%) |
1.39 |
1.36 - 1.62 |
1.4393 times |
Mon 30 June 2025 |
1.40 (-3.45%) |
1.47 |
1.31 - 1.57 |
0.998 times |
Fri 30 May 2025 |
1.45 (-13.69%) |
1.70 |
1.45 - 1.74 |
1.6043 times |
Wed 30 April 2025 |
1.68 (0.6%) |
1.68 |
1.30 - 1.74 |
0.7948 times |
Mon 31 March 2025 |
1.67 (16.78%) |
1.46 |
1.28 - 1.83 |
0.9075 times |
Fri 28 February 2025 |
1.43 (-9.49%) |
1.57 |
1.43 - 1.63 |
0.5786 times |
Fri 31 January 2025 |
1.58 (9.72%) |
1.40 |
1.27 - 1.65 |
1.1098 times |
Tue 31 December 2024 |
1.44 (-28.36%) |
1.92 |
1.41 - 1.98 |
0.9044 times |

DMA SMA EMA moving averages of National Steel SID
DMA (daily moving average) of National Steel SID
| DMA period | DMA value | | 5 day DMA | 1.58 | | 12 day DMA | 1.58 | | 20 day DMA | 1.55 | | 35 day DMA | 1.51 | | 50 day DMA | 1.46 | | 100 day DMA | 1.47 | | 150 day DMA | 1.52 | | 200 day DMA | 1.51 | EMA (exponential moving average) of National Steel SID
| EMA period | EMA current | EMA prev | EMA prev2 | | 5 day EMA | 1.6 | 1.58 | 1.55 | | 12 day EMA | 1.58 | 1.57 | 1.55 | | 20 day EMA | 1.55 | 1.54 | 1.53 | | 35 day EMA | 1.51 | 1.5 | 1.49 | | 50 day EMA | 1.46 | 1.45 | 1.44 |
SMA (simple moving average) of National Steel SID
| SMA period | SMA current | SMA prev | SMA prev2 | | 5 day SMA | 1.58 | 1.56 | 1.54 | | 12 day SMA | 1.58 | 1.56 | 1.55 | | 20 day SMA | 1.55 | 1.54 | 1.54 | | 35 day SMA | 1.51 | 1.51 | 1.5 | | 50 day SMA | 1.46 | 1.46 | 1.45 | | 100 day SMA | 1.47 | 1.47 | 1.47 | | 150 day SMA | 1.52 | 1.52 | 1.51 | | 200 day SMA | 1.51 | 1.51 | 1.5 |
|
|
