SiBone SIBN full analysis,charts,indicators,moving averages,SMA,DMA,EMA,ADX,MACD,RSISi Bone SIBN WideScreen charts, DMA,SMA,EMA technical analysis, forecast prediction, by indicators ADX,MACD,RSI,CCI USA stock exchange
operates under Health Care sector & deals in Medical Dental Instruments
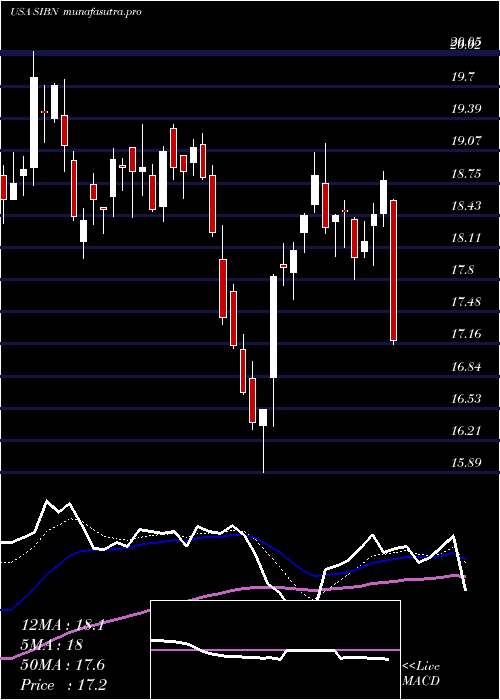
Daily price and charts and targets SiBone Strong Daily Stock price targets for SiBone SIBN are 14.98 and 15.48 | Daily Target 1 | 14.56 | | Daily Target 2 | 14.89 | | Daily Target 3 | 15.06 | | Daily Target 4 | 15.39 | | Daily Target 5 | 15.56 |
Daily price and volume Si Bone
| Date |
Closing |
Open |
Range |
Volume |
Mon 20 October 2025 |
15.22 (3.26%) |
14.91 |
14.73 - 15.23 |
0.5197 times |
Fri 17 October 2025 |
14.74 (-2.38%) |
15.05 |
14.71 - 15.28 |
0.7866 times |
Thu 16 October 2025 |
15.10 (-0.79%) |
15.23 |
15.01 - 15.57 |
0.7151 times |
Wed 15 October 2025 |
15.22 (-0.26%) |
15.27 |
14.58 - 15.39 |
1.1156 times |
Tue 14 October 2025 |
15.26 (2.14%) |
14.75 |
14.73 - 15.40 |
0.7641 times |
Mon 13 October 2025 |
14.94 (1.08%) |
14.99 |
14.77 - 15.16 |
0.7621 times |
Fri 10 October 2025 |
14.78 (-5.98%) |
15.69 |
14.78 - 15.83 |
1.1974 times |
Thu 09 October 2025 |
15.72 (3.35%) |
15.18 |
15.01 - 16.00 |
1.1281 times |
Wed 08 October 2025 |
15.21 (-0.78%) |
15.41 |
14.93 - 15.41 |
1.5443 times |
Tue 07 October 2025 |
15.33 (5.8%) |
14.57 |
14.40 - 15.33 |
1.4671 times |
Mon 06 October 2025 |
14.49 (-0.07%) |
14.60 |
14.20 - 14.72 |
0.8965 times |
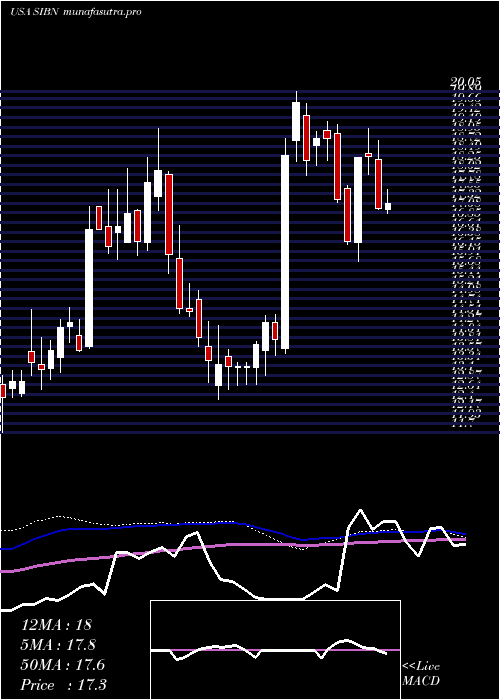
Weekly price and charts SiBone Strong weekly Stock price targets for SiBone SIBN are 14.98 and 15.48 | Weekly Target 1 | 14.56 | | Weekly Target 2 | 14.89 | | Weekly Target 3 | 15.06 | | Weekly Target 4 | 15.39 | | Weekly Target 5 | 15.56 |
Weekly price and volumes for Si Bone
| Date |
Closing |
Open |
Range |
Volume |
Mon 20 October 2025 |
15.22 (3.26%) |
14.91 |
14.73 - 15.23 |
0.1583 times |
Fri 17 October 2025 |
14.74 (-0.27%) |
14.99 |
14.58 - 15.57 |
1.2619 times |
Fri 10 October 2025 |
14.78 (1.93%) |
14.60 |
14.20 - 16.00 |
1.8984 times |
Fri 03 October 2025 |
14.50 (3.2%) |
14.14 |
13.94 - 14.76 |
1.1895 times |
Fri 26 September 2025 |
14.05 (-3.77%) |
14.64 |
13.81 - 15.05 |
1.2319 times |
Fri 19 September 2025 |
14.60 (-7.01%) |
15.74 |
14.48 - 15.86 |
1.4578 times |
Fri 12 September 2025 |
15.70 (-3.62%) |
16.34 |
15.51 - 16.40 |
1.2473 times |
Fri 05 September 2025 |
16.29 (-2.28%) |
16.47 |
15.95 - 16.88 |
0.6707 times |
Fri 29 August 2025 |
16.67 (0%) |
16.66 |
16.53 - 16.86 |
0.1208 times |
Fri 29 August 2025 |
16.67 (1.71%) |
16.30 |
16.02 - 16.86 |
0.7633 times |
Fri 22 August 2025 |
16.39 (6.02%) |
15.49 |
15.40 - 16.48 |
1.1987 times |
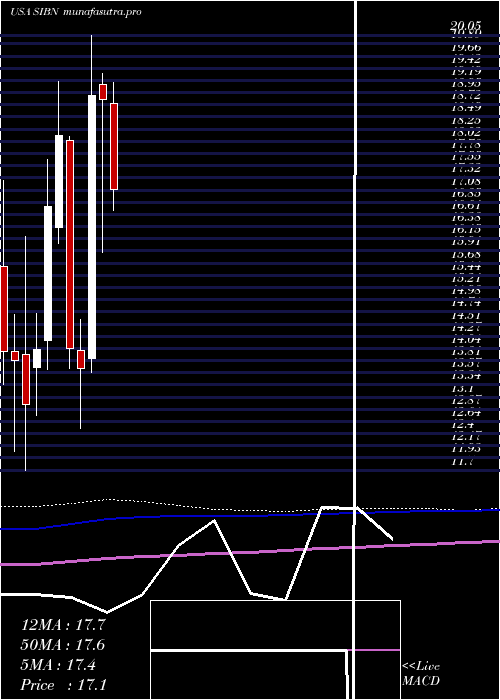
Monthly price and charts SiBone Strong monthly Stock price targets for SiBone SIBN are 14.58 and 16.64 | Monthly Target 1 | 12.99 | | Monthly Target 2 | 14.11 | | Monthly Target 3 | 15.053333333333 | | Monthly Target 4 | 16.17 | | Monthly Target 5 | 17.11 |
Monthly price and volumes Si Bone
| Date |
Closing |
Open |
Range |
Volume |
Mon 20 October 2025 |
15.22 (3.4%) |
14.46 |
13.94 - 16.00 |
0.787 times |
Tue 30 September 2025 |
14.72 (-11.7%) |
16.47 |
13.81 - 16.88 |
0.9956 times |
Fri 29 August 2025 |
16.67 (-2.11%) |
16.79 |
15.11 - 17.67 |
1.1752 times |
Thu 31 July 2025 |
17.03 (-9.51%) |
18.75 |
16.39 - 19.14 |
0.8024 times |
Mon 30 June 2025 |
18.82 (-0.42%) |
19.10 |
15.89 - 19.33 |
1.2614 times |
Fri 30 May 2025 |
18.90 (38.46%) |
13.84 |
13.58 - 20.05 |
1.4835 times |
Wed 30 April 2025 |
13.65 (-2.71%) |
13.99 |
12.50 - 14.60 |
0.7858 times |
Mon 31 March 2025 |
14.03 (-22.57%) |
18.03 |
13.65 - 18.11 |
0.8416 times |
Fri 28 February 2025 |
18.12 (8.11%) |
16.36 |
16.05 - 19.16 |
1.045 times |
Fri 31 January 2025 |
16.76 (19.54%) |
14.19 |
13.63 - 17.66 |
0.8224 times |
Tue 31 December 2024 |
14.02 (8.18%) |
13.68 |
12.76 - 14.72 |
0.5133 times |
DMA SMA EMA moving averages of Si Bone SIBN
DMA (daily moving average) of Si Bone SIBN
| DMA period | DMA value | | 5 day DMA | 15.11 | | 12 day DMA | 15.04 | | 20 day DMA | 14.73 | | 35 day DMA | 15.13 | | 50 day DMA | 15.37 | | 100 day DMA | 16.54 | | 150 day DMA | 16.15 | | 200 day DMA | 16.23 | EMA (exponential moving average) of Si Bone SIBN
| EMA period | EMA current | EMA prev | EMA prev2 | | 5 day EMA | 15.07 | 14.99 | 15.12 | | 12 day EMA | 15 | 14.96 | 15 | | 20 day EMA | 14.99 | 14.97 | 14.99 | | 35 day EMA | 15.16 | 15.16 | 15.18 | | 50 day EMA | 15.39 | 15.4 | 15.43 |
SMA (simple moving average) of Si Bone SIBN
| SMA period | SMA current | SMA prev | SMA prev2 | | 5 day SMA | 15.11 | 15.05 | 15.06 | | 12 day SMA | 15.04 | 14.97 | 14.93 | | 20 day SMA | 14.73 | 14.71 | 14.71 | | 35 day SMA | 15.13 | 15.17 | 15.22 | | 50 day SMA | 15.37 | 15.38 | 15.4 | | 100 day SMA | 16.54 | 16.57 | 16.61 | | 150 day SMA | 16.15 | 16.14 | 16.14 | | 200 day SMA | 16.23 | 16.22 | 16.22 |
|
|
