SeanergyMaritime SHIP full analysis,charts,indicators,moving averages,SMA,DMA,EMA,ADX,MACD,RSISeanergy Maritime SHIP WideScreen charts, DMA,SMA,EMA technical analysis, forecast prediction, by indicators ADX,MACD,RSI,CCI USA stock exchange
operates under Transportation sector & deals in Marine Transportation
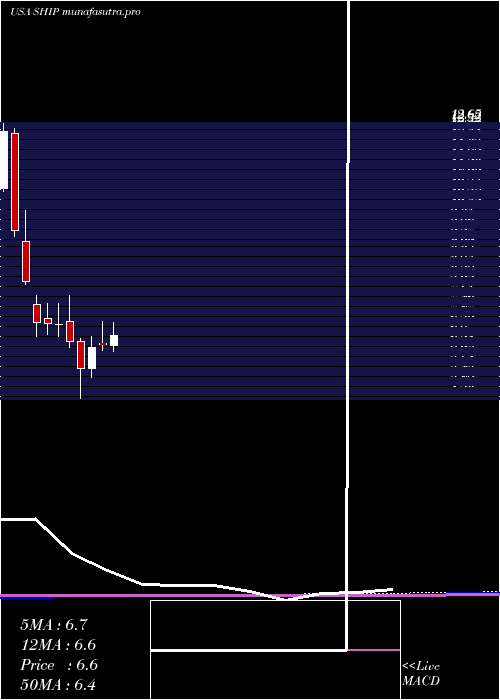
Daily price and charts and targets SeanergyMaritime Strong Daily Stock price targets for SeanergyMaritime SHIP are 8.01 and 8.31 | Daily Target 1 | 7.77 | | Daily Target 2 | 7.94 | | Daily Target 3 | 8.07 | | Daily Target 4 | 8.24 | | Daily Target 5 | 8.37 |
Daily price and volume Seanergy Maritime
| Date |
Closing |
Open |
Range |
Volume |
Mon 20 October 2025 |
8.11 (1%) |
7.98 |
7.90 - 8.20 |
0.5377 times |
Fri 17 October 2025 |
8.03 (-0.5%) |
8.00 |
7.91 - 8.14 |
0.4669 times |
Thu 16 October 2025 |
8.07 (0.25%) |
8.09 |
8.02 - 8.26 |
1.151 times |
Wed 15 October 2025 |
8.05 (0.25%) |
8.03 |
8.01 - 8.16 |
0.9398 times |
Tue 14 October 2025 |
8.03 (-0.74%) |
7.99 |
7.86 - 8.05 |
0.8953 times |
Mon 13 October 2025 |
8.09 (4.93%) |
7.95 |
7.92 - 8.18 |
0.9884 times |
Fri 10 October 2025 |
7.71 (-4.22%) |
7.93 |
7.66 - 8.14 |
2.2096 times |
Thu 09 October 2025 |
8.05 (-2.07%) |
8.26 |
8.05 - 8.37 |
0.8917 times |
Wed 08 October 2025 |
8.22 (-0.72%) |
8.28 |
8.09 - 8.28 |
0.968 times |
Tue 07 October 2025 |
8.28 (-0.72%) |
8.31 |
8.18 - 8.34 |
0.9518 times |
Mon 06 October 2025 |
8.34 (0.72%) |
8.31 |
8.29 - 8.48 |
0.6619 times |
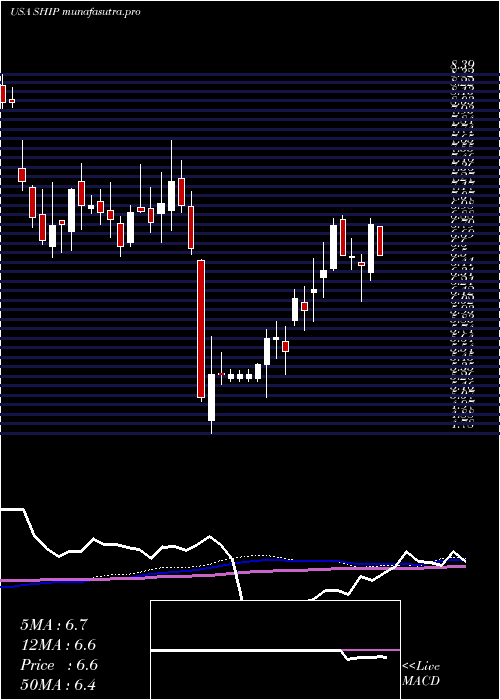
Weekly price and charts SeanergyMaritime Strong weekly Stock price targets for SeanergyMaritime SHIP are 8.01 and 8.31 | Weekly Target 1 | 7.77 | | Weekly Target 2 | 7.94 | | Weekly Target 3 | 8.07 | | Weekly Target 4 | 8.24 | | Weekly Target 5 | 8.37 |
Weekly price and volumes for Seanergy Maritime
| Date |
Closing |
Open |
Range |
Volume |
Mon 20 October 2025 |
8.11 (1%) |
7.98 |
7.90 - 8.20 |
0.1526 times |
Fri 17 October 2025 |
8.03 (4.15%) |
7.95 |
7.86 - 8.26 |
1.2605 times |
Fri 10 October 2025 |
7.71 (-6.88%) |
8.31 |
7.66 - 8.48 |
1.6129 times |
Fri 03 October 2025 |
8.28 (-4.28%) |
8.65 |
8.01 - 8.65 |
1.2047 times |
Fri 26 September 2025 |
8.65 (-1.37%) |
8.75 |
8.55 - 9.18 |
1.0682 times |
Fri 19 September 2025 |
8.77 (1.04%) |
8.69 |
8.62 - 9.11 |
0.9538 times |
Fri 12 September 2025 |
8.68 (8.64%) |
8.00 |
8.00 - 8.77 |
1.1726 times |
Fri 05 September 2025 |
7.99 (2.57%) |
7.67 |
7.56 - 8.32 |
1.2091 times |
Fri 29 August 2025 |
7.79 (0%) |
8.09 |
7.71 - 8.09 |
0.2366 times |
Fri 29 August 2025 |
7.79 (-0.26%) |
7.82 |
7.66 - 8.10 |
1.1289 times |
Fri 22 August 2025 |
7.81 (7.13%) |
7.23 |
7.21 - 7.82 |
1.049 times |
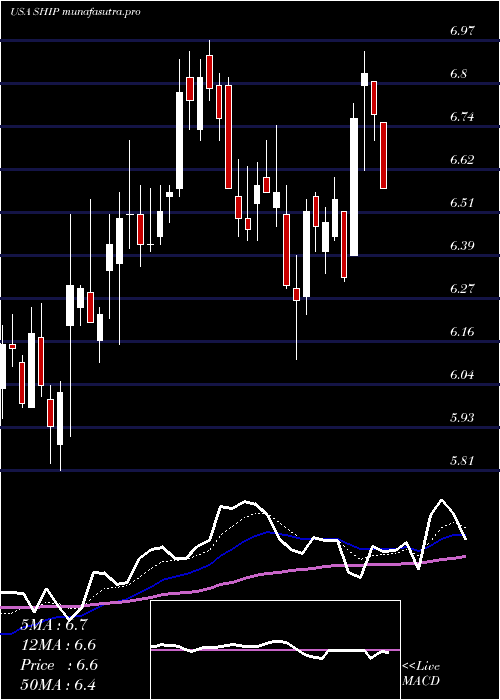
Monthly price and charts SeanergyMaritime Strong monthly Stock price targets for SeanergyMaritime SHIP are 7.41 and 8.37 | Monthly Target 1 | 7.17 | | Monthly Target 2 | 7.64 | | Monthly Target 3 | 8.13 | | Monthly Target 4 | 8.6 | | Monthly Target 5 | 9.09 |
Monthly price and volumes Seanergy Maritime
| Date |
Closing |
Open |
Range |
Volume |
Mon 20 October 2025 |
8.11 (-1.82%) |
8.23 |
7.66 - 8.62 |
0.702 times |
Tue 30 September 2025 |
8.26 (6.03%) |
7.67 |
7.56 - 9.18 |
0.9342 times |
Fri 29 August 2025 |
7.79 (14.22%) |
6.80 |
6.70 - 8.10 |
0.8019 times |
Thu 31 July 2025 |
6.82 (8.08%) |
6.30 |
6.11 - 7.35 |
0.7854 times |
Mon 30 June 2025 |
6.31 (1.28%) |
6.35 |
6.15 - 6.97 |
0.7152 times |
Fri 30 May 2025 |
6.23 (10.66%) |
5.63 |
5.37 - 6.54 |
0.6319 times |
Wed 30 April 2025 |
5.63 (-12.03%) |
6.41 |
4.78 - 6.48 |
1.0976 times |
Mon 31 March 2025 |
6.40 (-7.25%) |
6.99 |
6.24 - 7.73 |
1.3653 times |
Fri 28 February 2025 |
6.90 (-0.43%) |
6.89 |
6.56 - 7.49 |
1.3709 times |
Fri 31 January 2025 |
6.93 (-0.29%) |
7.05 |
6.60 - 7.50 |
1.5957 times |
Tue 31 December 2024 |
6.95 (-14.3%) |
7.45 |
6.55 - 7.73 |
1.1852 times |
DMA SMA EMA moving averages of Seanergy Maritime SHIP
DMA (daily moving average) of Seanergy Maritime SHIP
| DMA period | DMA value | | 5 day DMA | 8.06 | | 12 day DMA | 8.11 | | 20 day DMA | 8.31 | | 35 day DMA | 8.39 | | 50 day DMA | 8.16 | | 100 day DMA | 7.44 | | 150 day DMA | 6.93 | | 200 day DMA | 6.94 | EMA (exponential moving average) of Seanergy Maritime SHIP
| EMA period | EMA current | EMA prev | EMA prev2 | | 5 day EMA | 8.07 | 8.05 | 8.06 | | 12 day EMA | 8.14 | 8.14 | 8.16 | | 20 day EMA | 8.2 | 8.21 | 8.23 | | 35 day EMA | 8.14 | 8.14 | 8.15 | | 50 day EMA | 8.09 | 8.09 | 8.09 |
SMA (simple moving average) of Seanergy Maritime SHIP
| SMA period | SMA current | SMA prev | SMA prev2 | | 5 day SMA | 8.06 | 8.05 | 7.99 | | 12 day SMA | 8.11 | 8.11 | 8.16 | | 20 day SMA | 8.31 | 8.35 | 8.38 | | 35 day SMA | 8.39 | 8.38 | 8.37 | | 50 day SMA | 8.16 | 8.14 | 8.13 | | 100 day SMA | 7.44 | 7.43 | 7.41 | | 150 day SMA | 6.93 | 6.92 | 6.92 | | 200 day SMA | 6.94 | 6.94 | 6.93 |
|
|
