ShinhanFinancial SHG full analysis,charts,indicators,moving averages,SMA,DMA,EMA,ADX,MACD,RSIShinhan Financial SHG WideScreen charts, DMA,SMA,EMA technical analysis, forecast prediction, by indicators ADX,MACD,RSI,CCI USA stock exchange
operates under Finance sector & deals in Major Banks
Daily price and charts and targets ShinhanFinancial Strong Daily Stock price targets for ShinhanFinancial SHG are 46.58 and 47.17 | Daily Target 1 | 46.08 | | Daily Target 2 | 46.48 | | Daily Target 3 | 46.673333333333 | | Daily Target 4 | 47.07 | | Daily Target 5 | 47.26 |
Daily price and volume Shinhan Financial
| Date |
Closing |
Open |
Range |
Volume |
Tue 02 September 2025 |
46.87 (-0.76%) |
46.44 |
46.28 - 46.87 |
1.3204 times |
Fri 29 August 2025 |
47.23 (0%) |
46.88 |
46.73 - 47.25 |
1.4142 times |
Fri 29 August 2025 |
47.23 (-1.69%) |
46.88 |
46.73 - 47.25 |
1.4142 times |
Thu 28 August 2025 |
48.04 (1.37%) |
47.68 |
47.68 - 48.04 |
0.6947 times |
Wed 27 August 2025 |
47.39 (0.34%) |
47.12 |
46.84 - 47.40 |
0.8584 times |
Tue 26 August 2025 |
47.23 (-1.17%) |
46.97 |
46.77 - 47.26 |
1.0927 times |
Mon 25 August 2025 |
47.79 (-2.43%) |
48.54 |
47.79 - 48.54 |
0.9094 times |
Fri 22 August 2025 |
48.98 (1.81%) |
48.25 |
48.25 - 49.11 |
0.7188 times |
Thu 21 August 2025 |
48.11 (-0.15%) |
48.17 |
47.93 - 48.17 |
0.638 times |
Wed 20 August 2025 |
48.18 (-0.12%) |
48.11 |
47.87 - 48.19 |
0.9392 times |
Tue 19 August 2025 |
48.24 (-1.03%) |
48.62 |
48.23 - 48.70 |
1.4782 times |
Weekly price and charts ShinhanFinancial Strong weekly Stock price targets for ShinhanFinancial SHG are 46.58 and 47.17 | Weekly Target 1 | 46.08 | | Weekly Target 2 | 46.48 | | Weekly Target 3 | 46.673333333333 | | Weekly Target 4 | 47.07 | | Weekly Target 5 | 47.26 |
Weekly price and volumes for Shinhan Financial
| Date |
Closing |
Open |
Range |
Volume |
Tue 02 September 2025 |
46.87 (-0.76%) |
46.44 |
46.28 - 46.87 |
0.2099 times |
Fri 29 August 2025 |
47.23 (0%) |
46.88 |
46.73 - 47.25 |
0.2249 times |
Fri 29 August 2025 |
47.23 (-3.57%) |
48.54 |
46.73 - 48.54 |
0.7901 times |
Fri 22 August 2025 |
48.98 (-1.88%) |
48.80 |
47.87 - 49.11 |
0.7323 times |
Fri 15 August 2025 |
49.92 (-0.46%) |
49.90 |
49.67 - 51.00 |
0.7264 times |
Fri 08 August 2025 |
50.15 (6.09%) |
49.00 |
48.55 - 50.28 |
0.6076 times |
Fri 01 August 2025 |
47.27 (-7.15%) |
48.67 |
46.47 - 49.48 |
1.1738 times |
Fri 25 July 2025 |
50.91 (3.29%) |
49.60 |
48.65 - 52.00 |
1.1898 times |
Fri 18 July 2025 |
49.29 (-0.6%) |
51.21 |
49.06 - 51.48 |
2.0067 times |
Fri 11 July 2025 |
49.59 (7.13%) |
47.49 |
46.25 - 51.21 |
2.3385 times |
Thu 03 July 2025 |
46.29 (4.44%) |
44.87 |
44.79 - 46.53 |
0.623 times |

Monthly price and charts ShinhanFinancial Strong monthly Stock price targets for ShinhanFinancial SHG are 46.58 and 47.17 | Monthly Target 1 | 46.08 | | Monthly Target 2 | 46.48 | | Monthly Target 3 | 46.673333333333 | | Monthly Target 4 | 47.07 | | Monthly Target 5 | 47.26 |
Monthly price and volumes Shinhan Financial
| Date |
Closing |
Open |
Range |
Volume |
Tue 02 September 2025 |
46.87 (-0.76%) |
46.44 |
46.28 - 46.87 |
0.0451 times |
Fri 29 August 2025 |
47.23 (-3.02%) |
47.00 |
46.47 - 51.00 |
0.7267 times |
Thu 31 July 2025 |
48.70 (7.79%) |
45.53 |
45.07 - 52.00 |
1.4768 times |
Mon 30 June 2025 |
45.18 (8.97%) |
40.42 |
40.02 - 45.23 |
0.878 times |
Fri 30 May 2025 |
41.46 (15.23%) |
36.06 |
35.24 - 41.60 |
0.9077 times |
Wed 30 April 2025 |
35.98 (12.16%) |
32.32 |
28.76 - 36.06 |
1.1604 times |
Mon 31 March 2025 |
32.08 (0.41%) |
32.33 |
30.80 - 33.50 |
1.3783 times |
Fri 28 February 2025 |
31.95 (-8.77%) |
34.28 |
31.68 - 35.39 |
1.6078 times |
Fri 31 January 2025 |
35.02 (6.51%) |
32.86 |
32.50 - 35.77 |
1.0387 times |
Tue 31 December 2024 |
32.88 (-16.36%) |
35.75 |
32.57 - 36.03 |
0.7805 times |
Tue 26 November 2024 |
39.31 (3.94%) |
39.12 |
38.04 - 41.37 |
0.6169 times |

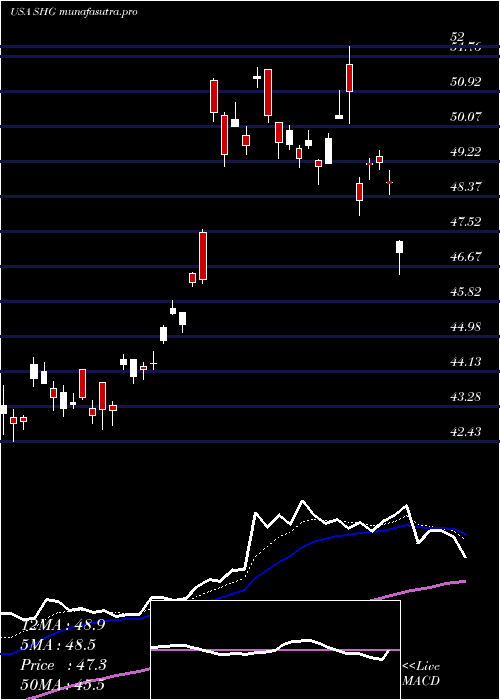
DMA SMA EMA moving averages of Shinhan Financial SHG
DMA (daily moving average) of Shinhan Financial SHG
| DMA period | DMA value | | 5 day DMA | 47.35 | | 12 day DMA | 47.84 | | 20 day DMA | 48.74 | | 35 day DMA | 49.01 | | 50 day DMA | 48.31 | | 100 day DMA | 43.16 | | 150 day DMA | 39.74 | | 200 day DMA | 38.81 | EMA (exponential moving average) of Shinhan Financial SHG
| EMA period | EMA current | EMA prev | EMA prev2 | | 5 day EMA | 47.3 | 47.52 | 47.67 | | 12 day EMA | 47.86 | 48.04 | 48.19 | | 20 day EMA | 48.17 | 48.31 | 48.42 | | 35 day EMA | 48.06 | 48.13 | 48.18 | | 50 day EMA | 47.8 | 47.84 | 47.87 |
SMA (simple moving average) of Shinhan Financial SHG
| SMA period | SMA current | SMA prev | SMA prev2 | | 5 day SMA | 47.35 | 47.42 | 47.54 | | 12 day SMA | 47.84 | 48.09 | 48.32 | | 20 day SMA | 48.74 | 48.84 | 48.84 | | 35 day SMA | 49.01 | 49.13 | 49.2 | | 50 day SMA | 48.31 | 48.24 | 48.16 | | 100 day SMA | 43.16 | 43 | 42.84 | | 150 day SMA | 39.74 | 39.66 | 39.58 | | 200 day SMA | 38.81 | 38.77 | 38.73 |
|
|
