ShenandoahTelecommunications SHEN full analysis,charts,indicators,moving averages,SMA,DMA,EMA,ADX,MACD,RSIShenandoah Telecommunications SHEN WideScreen charts, DMA,SMA,EMA technical analysis, forecast prediction, by indicators ADX,MACD,RSI,CCI USA stock exchange
operates under Public Utilities sector & deals in Telecommunications Equipment
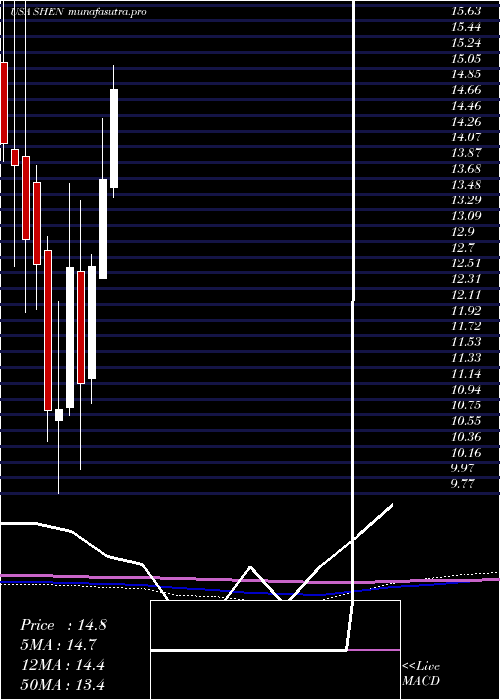
Daily price and charts and targets ShenandoahTelecommunications Strong Daily Stock price targets for ShenandoahTelecommunications SHEN are 10.74 and 11.01 | Daily Target 1 | 10.52 | | Daily Target 2 | 10.69 | | Daily Target 3 | 10.786666666667 | | Daily Target 4 | 10.96 | | Daily Target 5 | 11.06 |
Daily price and volume Shenandoah Telecommunications
| Date |
Closing |
Open |
Range |
Volume |
Thu 04 December 2025 |
10.87 (0.74%) |
10.75 |
10.61 - 10.88 |
0.8273 times |
Wed 03 December 2025 |
10.79 (0%) |
10.83 |
10.78 - 10.96 |
0.6277 times |
Tue 02 December 2025 |
10.79 (0.37%) |
10.78 |
10.66 - 10.87 |
0.7906 times |
Mon 01 December 2025 |
10.75 (-1.65%) |
10.85 |
10.65 - 10.99 |
0.7087 times |
Fri 28 November 2025 |
10.93 (-0.55%) |
11.03 |
10.75 - 11.10 |
0.5008 times |
Wed 26 November 2025 |
10.99 (-0.18%) |
10.99 |
10.97 - 11.24 |
1.5676 times |
Tue 25 November 2025 |
11.01 (2.23%) |
10.84 |
10.84 - 11.12 |
0.9966 times |
Mon 24 November 2025 |
10.77 (1.13%) |
10.65 |
10.60 - 10.83 |
1.6166 times |
Fri 21 November 2025 |
10.65 (5.76%) |
10.11 |
9.77 - 10.76 |
1.2218 times |
Thu 20 November 2025 |
10.07 (1.1%) |
10.21 |
9.99 - 10.24 |
1.1424 times |
Wed 19 November 2025 |
9.96 (-0.99%) |
10.04 |
9.67 - 10.04 |
1.3192 times |
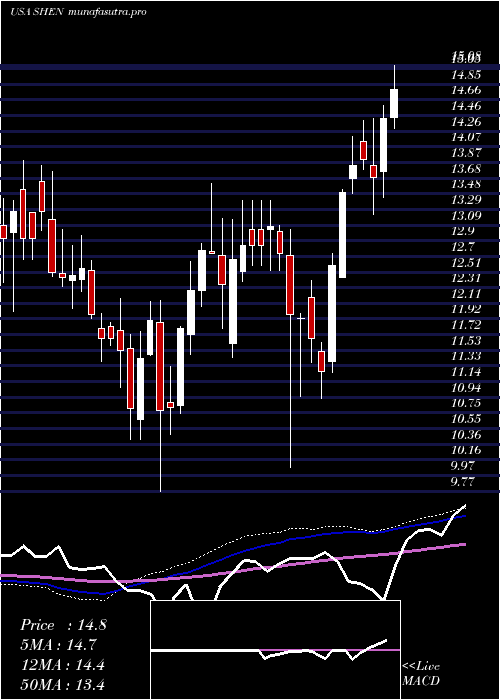
Weekly price and charts ShenandoahTelecommunications Strong weekly Stock price targets for ShenandoahTelecommunications SHEN are 10.74 and 11.12 | Weekly Target 1 | 10.44 | | Weekly Target 2 | 10.66 | | Weekly Target 3 | 10.823333333333 | | Weekly Target 4 | 11.04 | | Weekly Target 5 | 11.2 |
Weekly price and volumes for Shenandoah Telecommunications
| Date |
Closing |
Open |
Range |
Volume |
Thu 04 December 2025 |
10.87 (-0.55%) |
10.85 |
10.61 - 10.99 |
0.7104 times |
Fri 28 November 2025 |
10.93 (2.63%) |
10.65 |
10.60 - 11.24 |
1.1258 times |
Fri 21 November 2025 |
10.65 (2.9%) |
10.31 |
9.67 - 10.76 |
1.43 times |
Fri 14 November 2025 |
10.35 (-5.05%) |
11.01 |
10.14 - 11.29 |
0.9046 times |
Fri 07 November 2025 |
10.90 (-11.53%) |
12.12 |
10.84 - 12.18 |
0.9659 times |
Fri 31 October 2025 |
12.32 (0%) |
12.34 |
12.05 - 12.50 |
0.3943 times |
Fri 31 October 2025 |
12.32 (-6.1%) |
13.15 |
12.03 - 13.44 |
1.5134 times |
Fri 24 October 2025 |
13.12 (-0.38%) |
13.25 |
12.53 - 13.31 |
0.9817 times |
Fri 17 October 2025 |
13.17 (0.38%) |
13.28 |
13.06 - 13.83 |
0.9347 times |
Fri 10 October 2025 |
13.12 (-5.07%) |
13.90 |
12.99 - 13.90 |
1.0393 times |
Fri 03 October 2025 |
13.82 (3.99%) |
13.32 |
13.02 - 14.00 |
0.7403 times |
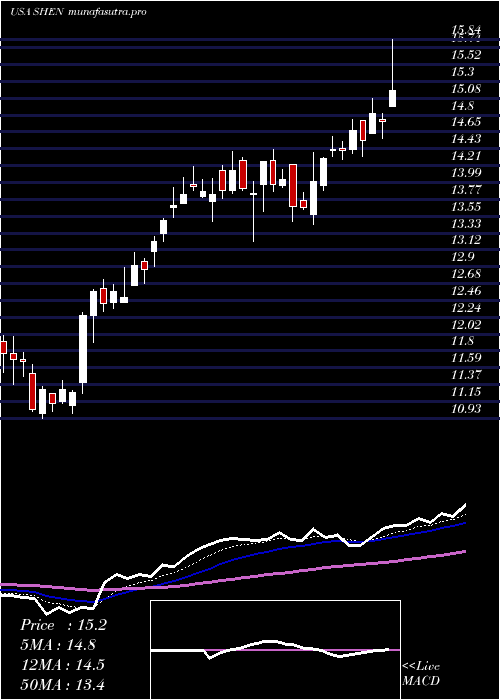
Monthly price and charts ShenandoahTelecommunications Strong monthly Stock price targets for ShenandoahTelecommunications SHEN are 10.74 and 11.12 | Monthly Target 1 | 10.44 | | Monthly Target 2 | 10.66 | | Monthly Target 3 | 10.823333333333 | | Monthly Target 4 | 11.04 | | Monthly Target 5 | 11.2 |
Monthly price and volumes Shenandoah Telecommunications
| Date |
Closing |
Open |
Range |
Volume |
Thu 04 December 2025 |
10.87 (-0.55%) |
10.85 |
10.61 - 10.99 |
0.1586 times |
Fri 28 November 2025 |
10.93 (-11.28%) |
12.12 |
9.67 - 12.18 |
0.988 times |
Fri 31 October 2025 |
12.32 (-8.2%) |
13.31 |
12.03 - 14.00 |
1.1847 times |
Tue 30 September 2025 |
13.42 (1.28%) |
13.14 |
12.67 - 14.47 |
1.2236 times |
Fri 29 August 2025 |
13.25 (-9.74%) |
14.39 |
11.71 - 14.91 |
1.2382 times |
Thu 31 July 2025 |
14.68 (7.47%) |
13.57 |
13.44 - 15.84 |
1.1034 times |
Mon 30 June 2025 |
13.66 (8.59%) |
12.44 |
12.44 - 14.42 |
0.9611 times |
Fri 30 May 2025 |
12.58 (12.93%) |
11.20 |
10.88 - 12.73 |
1.1291 times |
Wed 30 April 2025 |
11.14 (-11.38%) |
12.52 |
10.07 - 13.40 |
0.9877 times |
Mon 31 March 2025 |
12.57 (16.28%) |
10.84 |
10.74 - 13.61 |
1.0258 times |
Fri 28 February 2025 |
10.81 (0.09%) |
10.67 |
9.77 - 12.15 |
0.7307 times |
DMA SMA EMA moving averages of Shenandoah Telecommunications SHEN
DMA (daily moving average) of Shenandoah Telecommunications SHEN
| DMA period | DMA value | | 5 day DMA | 10.83 | | 12 day DMA | 10.64 | | 20 day DMA | 10.67 | | 35 day DMA | 11.51 | | 50 day DMA | 12.08 | | 100 day DMA | 12.85 | | 150 day DMA | 12.91 | | 200 day DMA | 12.73 | EMA (exponential moving average) of Shenandoah Telecommunications SHEN
| EMA period | EMA current | EMA prev | EMA prev2 | | 5 day EMA | 10.82 | 10.8 | 10.8 | | 12 day EMA | 10.79 | 10.78 | 10.78 | | 20 day EMA | 10.97 | 10.98 | 11 | | 35 day EMA | 11.45 | 11.48 | 11.52 | | 50 day EMA | 12.09 | 12.14 | 12.19 |
SMA (simple moving average) of Shenandoah Telecommunications SHEN
| SMA period | SMA current | SMA prev | SMA prev2 | | 5 day SMA | 10.83 | 10.85 | 10.89 | | 12 day SMA | 10.64 | 10.56 | 10.52 | | 20 day SMA | 10.67 | 10.7 | 10.74 | | 35 day SMA | 11.51 | 11.59 | 11.67 | | 50 day SMA | 12.08 | 12.13 | 12.18 | | 100 day SMA | 12.85 | 12.88 | 12.93 | | 150 day SMA | 12.91 | 12.91 | 12.93 | | 200 day SMA | 12.73 | 12.74 | 12.74 |
|
|
