ShoreBancshares SHBI full analysis,charts,indicators,moving averages,SMA,DMA,EMA,ADX,MACD,RSIShore Bancshares SHBI WideScreen charts, DMA,SMA,EMA technical analysis, forecast prediction, by indicators ADX,MACD,RSI,CCI USA stock exchange
operates under Finance sector & deals in Major Banks
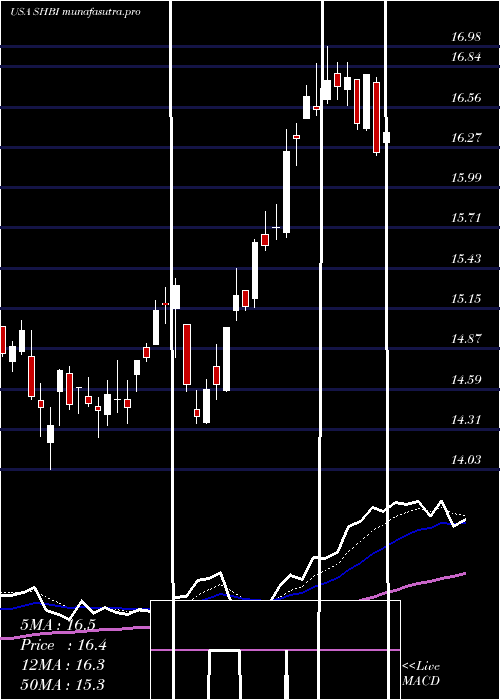
Daily price and charts and targets ShoreBancshares Strong Daily Stock price targets for ShoreBancshares SHBI are 17.65 and 17.87 | Daily Target 1 | 17.49 | | Daily Target 2 | 17.59 | | Daily Target 3 | 17.713333333333 | | Daily Target 4 | 17.81 | | Daily Target 5 | 17.93 |
Daily price and volume Shore Bancshares
| Date |
Closing |
Open |
Range |
Volume |
Thu 04 December 2025 |
17.68 (-0.28%) |
17.62 |
17.62 - 17.84 |
0.6892 times |
Wed 03 December 2025 |
17.73 (1.66%) |
17.53 |
17.49 - 17.78 |
0.6567 times |
Tue 02 December 2025 |
17.44 (-0.74%) |
17.75 |
17.38 - 17.75 |
0.8144 times |
Mon 01 December 2025 |
17.57 (0.57%) |
17.26 |
17.26 - 17.83 |
0.7892 times |
Fri 28 November 2025 |
17.47 (-1.19%) |
17.68 |
17.39 - 17.69 |
0.5887 times |
Wed 26 November 2025 |
17.68 (1.38%) |
17.39 |
17.35 - 17.74 |
1.3696 times |
Tue 25 November 2025 |
17.44 (4.87%) |
16.74 |
16.74 - 17.45 |
1.267 times |
Mon 24 November 2025 |
16.63 (0.3%) |
16.55 |
16.38 - 16.78 |
1.0686 times |
Fri 21 November 2025 |
16.58 (3.11%) |
16.12 |
16.12 - 16.72 |
1.3629 times |
Thu 20 November 2025 |
16.08 (1.07%) |
16.10 |
16.03 - 16.38 |
1.3938 times |
Wed 19 November 2025 |
15.91 (2.32%) |
15.68 |
15.57 - 15.95 |
1.0923 times |
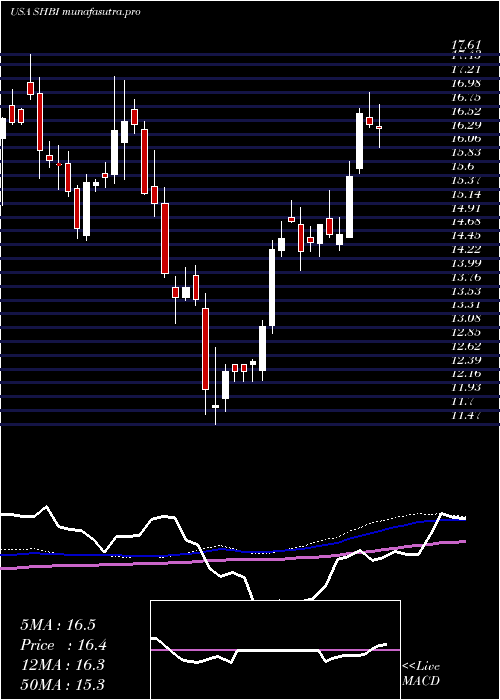
Weekly price and charts ShoreBancshares Strong weekly Stock price targets for ShoreBancshares SHBI are 17.47 and 18.05 | Weekly Target 1 | 17.01 | | Weekly Target 2 | 17.35 | | Weekly Target 3 | 17.593333333333 | | Weekly Target 4 | 17.93 | | Weekly Target 5 | 18.17 |
Weekly price and volumes for Shore Bancshares
| Date |
Closing |
Open |
Range |
Volume |
Thu 04 December 2025 |
17.68 (1.2%) |
17.26 |
17.26 - 17.84 |
0.8325 times |
Fri 28 November 2025 |
17.47 (5.37%) |
16.55 |
16.38 - 17.74 |
1.212 times |
Fri 21 November 2025 |
16.58 (3.62%) |
15.96 |
15.48 - 16.72 |
2.099 times |
Fri 14 November 2025 |
16.00 (-0.19%) |
16.16 |
15.81 - 16.64 |
0.9587 times |
Fri 07 November 2025 |
16.03 (2.69%) |
15.60 |
15.51 - 16.32 |
0.6227 times |
Fri 31 October 2025 |
15.61 (0%) |
15.55 |
15.46 - 15.70 |
0.2789 times |
Fri 31 October 2025 |
15.61 (-0.89%) |
15.76 |
15.45 - 16.10 |
1.162 times |
Fri 24 October 2025 |
15.75 (2.01%) |
15.54 |
14.93 - 16.35 |
1.1527 times |
Fri 17 October 2025 |
15.44 (-0.32%) |
15.77 |
15.12 - 16.56 |
0.9377 times |
Fri 10 October 2025 |
15.49 (-4.74%) |
16.41 |
15.49 - 16.63 |
0.7438 times |
Fri 03 October 2025 |
16.26 (-4.01%) |
17.03 |
16.11 - 17.03 |
0.8676 times |
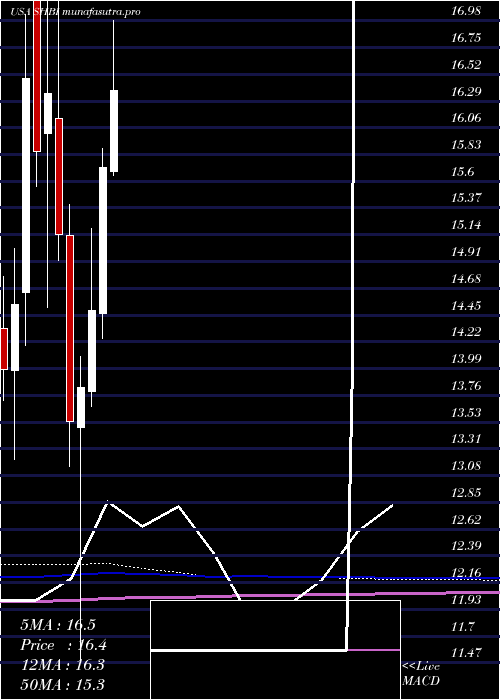
Monthly price and charts ShoreBancshares Strong monthly Stock price targets for ShoreBancshares SHBI are 17.47 and 18.05 | Monthly Target 1 | 17.01 | | Monthly Target 2 | 17.35 | | Monthly Target 3 | 17.593333333333 | | Monthly Target 4 | 17.93 | | Monthly Target 5 | 18.17 |
Monthly price and volumes Shore Bancshares
| Date |
Closing |
Open |
Range |
Volume |
Thu 04 December 2025 |
17.68 (1.2%) |
17.26 |
17.26 - 17.84 |
0.1829 times |
Fri 28 November 2025 |
17.47 (11.92%) |
15.60 |
15.48 - 17.74 |
1.0748 times |
Fri 31 October 2025 |
15.61 (-4.88%) |
16.30 |
14.93 - 16.63 |
1.0628 times |
Tue 30 September 2025 |
16.41 (-4.54%) |
16.96 |
16.19 - 17.67 |
0.9555 times |
Fri 29 August 2025 |
17.19 (10.83%) |
15.51 |
14.96 - 17.29 |
0.8145 times |
Thu 31 July 2025 |
15.51 (-1.34%) |
15.68 |
15.43 - 16.98 |
1.123 times |
Mon 30 June 2025 |
15.72 (8.49%) |
14.47 |
14.25 - 15.88 |
1.166 times |
Fri 30 May 2025 |
14.49 (4.77%) |
13.80 |
13.67 - 15.19 |
0.756 times |
Wed 30 April 2025 |
13.83 (2.14%) |
13.49 |
11.47 - 14.10 |
1.2185 times |
Mon 31 March 2025 |
13.54 (-10.57%) |
15.13 |
13.15 - 15.40 |
1.6461 times |
Fri 28 February 2025 |
15.14 (-7.4%) |
16.14 |
14.92 - 17.17 |
1.2941 times |
DMA SMA EMA moving averages of Shore Bancshares SHBI
DMA (daily moving average) of Shore Bancshares SHBI
| DMA period | DMA value | | 5 day DMA | 17.58 | | 12 day DMA | 16.98 | | 20 day DMA | 16.62 | | 35 day DMA | 16.24 | | 50 day DMA | 16.25 | | 100 day DMA | 16.36 | | 150 day DMA | 15.95 | | 200 day DMA | 15.36 | EMA (exponential moving average) of Shore Bancshares SHBI
| EMA period | EMA current | EMA prev | EMA prev2 | | 5 day EMA | 17.55 | 17.48 | 17.35 | | 12 day EMA | 17.14 | 17.04 | 16.92 | | 20 day EMA | 16.84 | 16.75 | 16.65 | | 35 day EMA | 16.63 | 16.57 | 16.5 | | 50 day EMA | 16.45 | 16.4 | 16.35 |
SMA (simple moving average) of Shore Bancshares SHBI
| SMA period | SMA current | SMA prev | SMA prev2 | | 5 day SMA | 17.58 | 17.58 | 17.52 | | 12 day SMA | 16.98 | 16.8 | 16.66 | | 20 day SMA | 16.62 | 16.55 | 16.45 | | 35 day SMA | 16.24 | 16.19 | 16.16 | | 50 day SMA | 16.25 | 16.24 | 16.22 | | 100 day SMA | 16.36 | 16.34 | 16.34 | | 150 day SMA | 15.95 | 15.92 | 15.9 | | 200 day SMA | 15.36 | 15.35 | 15.34 |
|
|
