SangamoTherapeutics SGMO full analysis,charts,indicators,moving averages,SMA,DMA,EMA,ADX,MACD,RSISangamo Therapeutics SGMO WideScreen charts, DMA,SMA,EMA technical analysis, forecast prediction, by indicators ADX,MACD,RSI,CCI USA stock exchange
operates under Health Care sector & deals in Biotechnology Biological Products No Diagnostic Substances
Daily price and charts and targets SangamoTherapeutics Strong Daily Stock price targets for SangamoTherapeutics SGMO are 0.5 and 0.58 | Daily Target 1 | 0.44 | | Daily Target 2 | 0.48 | | Daily Target 3 | 0.51666666666667 | | Daily Target 4 | 0.56 | | Daily Target 5 | 0.6 |
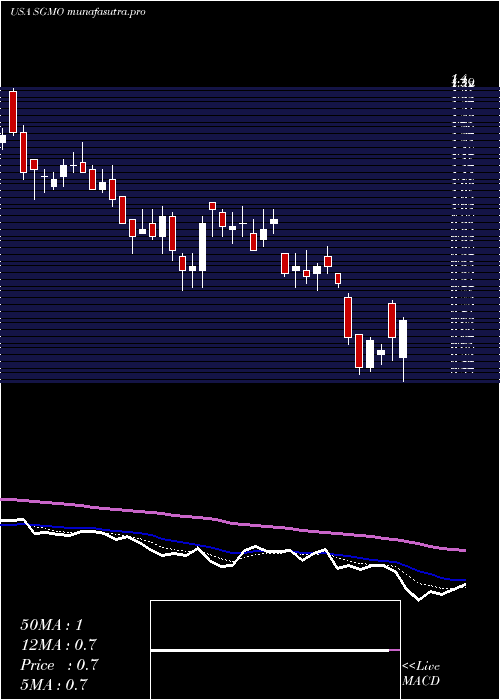
Daily price and volume Sangamo Therapeutics
| Date |
Closing |
Open |
Range |
Volume |
Thu 04 December 2025 |
0.53 (6%) |
0.48 |
0.47 - 0.55 |
0.5679 times |
Wed 03 December 2025 |
0.50 (13.64%) |
0.43 |
0.43 - 0.50 |
0.5322 times |
Tue 02 December 2025 |
0.44 (2.33%) |
0.45 |
0.42 - 0.56 |
2.147 times |
Mon 01 December 2025 |
0.43 (-6.52%) |
0.45 |
0.43 - 0.46 |
0.2338 times |
Fri 28 November 2025 |
0.46 (0%) |
0.47 |
0.45 - 0.48 |
0.2019 times |
Wed 26 November 2025 |
0.46 (9.52%) |
0.42 |
0.41 - 0.46 |
0.4762 times |
Tue 25 November 2025 |
0.42 (0%) |
0.42 |
0.39 - 0.44 |
0.2869 times |
Mon 24 November 2025 |
0.42 (0%) |
0.42 |
0.40 - 0.46 |
0.655 times |
Fri 21 November 2025 |
0.42 (7.69%) |
0.54 |
0.40 - 0.56 |
4.5623 times |
Thu 20 November 2025 |
0.39 (0%) |
0.42 |
0.38 - 0.43 |
0.3368 times |
Wed 19 November 2025 |
0.39 (-7.14%) |
0.43 |
0.39 - 0.43 |
0.4564 times |
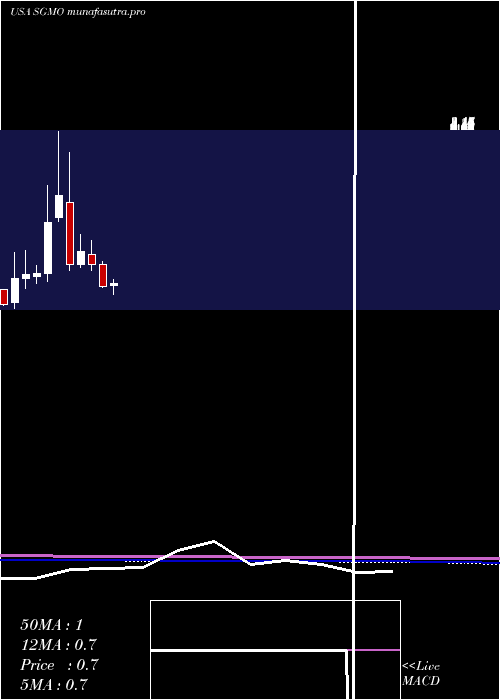
Weekly price and charts SangamoTherapeutics Strong weekly Stock price targets for SangamoTherapeutics SGMO are 0.48 and 0.62 | Weekly Target 1 | 0.36 | | Weekly Target 2 | 0.45 | | Weekly Target 3 | 0.50333333333333 | | Weekly Target 4 | 0.59 | | Weekly Target 5 | 0.64 |
Weekly price and volumes for Sangamo Therapeutics
| Date |
Closing |
Open |
Range |
Volume |
Thu 04 December 2025 |
0.53 (15.22%) |
0.45 |
0.42 - 0.56 |
1.641 times |
Fri 28 November 2025 |
0.46 (9.52%) |
0.42 |
0.39 - 0.48 |
0.7637 times |
Fri 21 November 2025 |
0.42 (-4.55%) |
0.44 |
0.38 - 0.56 |
2.8814 times |
Fri 14 November 2025 |
0.44 (-6.38%) |
0.48 |
0.44 - 0.54 |
0.6169 times |
Fri 07 November 2025 |
0.47 (-21.67%) |
0.58 |
0.42 - 0.60 |
0.8819 times |
Fri 31 October 2025 |
0.60 (0%) |
0.58 |
0.57 - 0.62 |
0.1522 times |
Fri 31 October 2025 |
0.60 (-6.25%) |
0.65 |
0.56 - 0.67 |
0.7626 times |
Fri 24 October 2025 |
0.64 (0%) |
0.66 |
0.62 - 0.69 |
0.6584 times |
Fri 17 October 2025 |
0.64 (-4.48%) |
0.69 |
0.60 - 0.72 |
0.7536 times |
Fri 10 October 2025 |
0.67 (-4.29%) |
0.72 |
0.65 - 0.76 |
0.8883 times |
Fri 03 October 2025 |
0.70 (6.06%) |
0.66 |
0.64 - 0.77 |
0.9828 times |
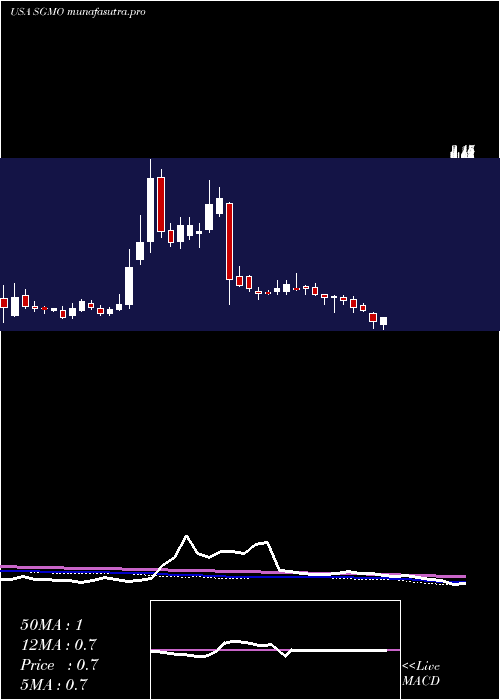
Monthly price and charts SangamoTherapeutics Strong monthly Stock price targets for SangamoTherapeutics SGMO are 0.48 and 0.62 | Monthly Target 1 | 0.36 | | Monthly Target 2 | 0.45 | | Monthly Target 3 | 0.50333333333333 | | Monthly Target 4 | 0.59 | | Monthly Target 5 | 0.64 |
Monthly price and volumes Sangamo Therapeutics
| Date |
Closing |
Open |
Range |
Volume |
Thu 04 December 2025 |
0.53 (15.22%) |
0.45 |
0.42 - 0.56 |
0.4019 times |
Fri 28 November 2025 |
0.46 (-23.33%) |
0.58 |
0.38 - 0.60 |
1.2599 times |
Fri 31 October 2025 |
0.60 (-10.45%) |
0.67 |
0.56 - 0.76 |
0.8833 times |
Tue 30 September 2025 |
0.67 (28.85%) |
0.53 |
0.47 - 0.77 |
0.9619 times |
Fri 29 August 2025 |
0.52 (-3.7%) |
0.54 |
0.42 - 0.61 |
0.9902 times |
Thu 31 July 2025 |
0.54 (0%) |
0.53 |
0.47 - 0.70 |
1.0494 times |
Mon 30 June 2025 |
0.54 (14.89%) |
0.47 |
0.41 - 0.61 |
0.9717 times |
Fri 30 May 2025 |
0.47 (-38.96%) |
0.76 |
0.41 - 0.79 |
0.8325 times |
Wed 30 April 2025 |
0.77 (16.67%) |
0.67 |
0.53 - 0.84 |
1.7369 times |
Mon 31 March 2025 |
0.66 (-35.29%) |
1.02 |
0.64 - 1.06 |
0.9123 times |
Fri 28 February 2025 |
1.02 (-17.07%) |
1.17 |
0.91 - 1.40 |
0.5879 times |
DMA SMA EMA moving averages of Sangamo Therapeutics SGMO
DMA (daily moving average) of Sangamo Therapeutics SGMO
| DMA period | DMA value | | 5 day DMA | 0.47 | | 12 day DMA | 0.44 | | 20 day DMA | 0.45 | | 35 day DMA | 0.52 | | 50 day DMA | 0.57 | | 100 day DMA | 0.55 | | 150 day DMA | 0.54 | | 200 day DMA | 0.62 | EMA (exponential moving average) of Sangamo Therapeutics SGMO
| EMA period | EMA current | EMA prev | EMA prev2 | | 5 day EMA | 0.48 | 0.46 | 0.44 | | 12 day EMA | 0.47 | 0.46 | 0.45 | | 20 day EMA | 0.48 | 0.47 | 0.47 | | 35 day EMA | 0.5 | 0.5 | 0.5 | | 50 day EMA | 0.56 | 0.56 | 0.56 |
SMA (simple moving average) of Sangamo Therapeutics SGMO
| SMA period | SMA current | SMA prev | SMA prev2 | | 5 day SMA | 0.47 | 0.46 | 0.44 | | 12 day SMA | 0.44 | 0.43 | 0.43 | | 20 day SMA | 0.45 | 0.45 | 0.45 | | 35 day SMA | 0.52 | 0.52 | 0.53 | | 50 day SMA | 0.57 | 0.57 | 0.57 | | 100 day SMA | 0.55 | 0.55 | 0.55 | | 150 day SMA | 0.54 | 0.55 | 0.55 | | 200 day SMA | 0.62 | 0.62 | 0.62 |
|
|
