SiriusInternational SG full analysis,charts,indicators,moving averages,SMA,DMA,EMA,ADX,MACD,RSISirius International SG WideScreen charts, DMA,SMA,EMA technical analysis, forecast prediction, by indicators ADX,MACD,RSI,CCI USA stock exchange
operates under Finance sector & deals in Property Casualty Insurers
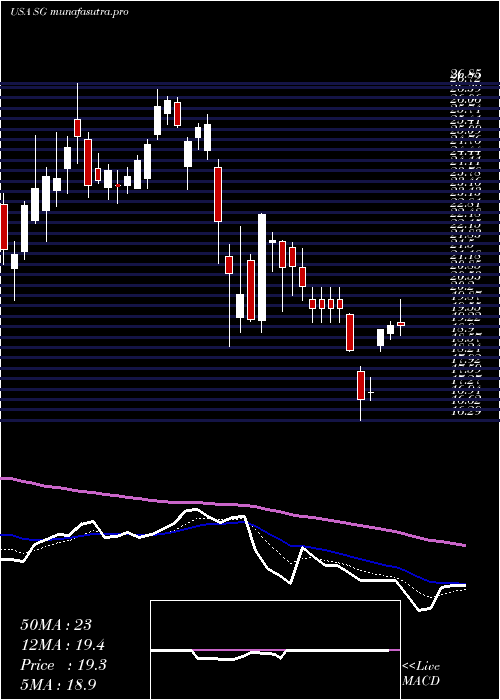
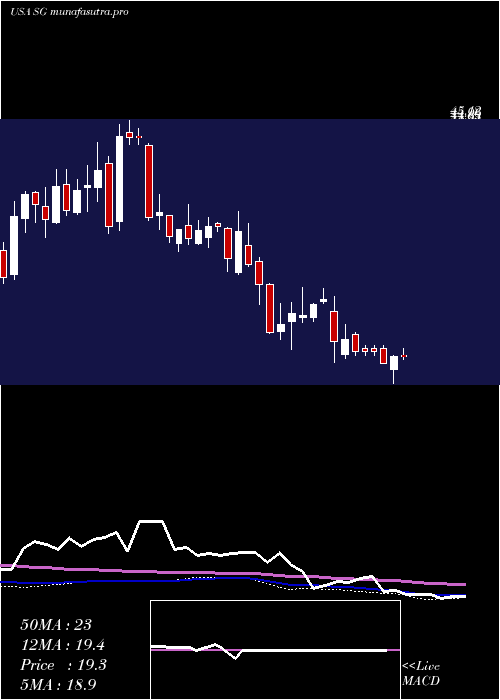
Daily price and charts and targets SiriusInternational Strong Daily Stock price targets for SiriusInternational SG are 6.84 and 7.11 | Daily Target 1 | 6.64 | | Daily Target 2 | 6.77 | | Daily Target 3 | 6.9066666666667 | | Daily Target 4 | 7.04 | | Daily Target 5 | 7.18 |
Daily price and volume Sirius International
| Date |
Closing |
Open |
Range |
Volume |
Thu 04 December 2025 |
6.91 (-0.58%) |
6.89 |
6.77 - 7.04 |
0.5214 times |
Wed 03 December 2025 |
6.95 (4.67%) |
6.72 |
6.62 - 6.96 |
0.8311 times |
Tue 02 December 2025 |
6.64 (3.59%) |
6.47 |
6.39 - 6.79 |
0.807 times |
Mon 01 December 2025 |
6.41 (-1.23%) |
6.39 |
6.27 - 6.55 |
1.543 times |
Fri 28 November 2025 |
6.49 (-2.11%) |
6.60 |
6.45 - 6.68 |
0.5451 times |
Wed 26 November 2025 |
6.63 (-3.35%) |
6.87 |
6.61 - 6.95 |
0.5585 times |
Tue 25 November 2025 |
6.86 (5.86%) |
6.48 |
6.45 - 6.99 |
0.8678 times |
Mon 24 November 2025 |
6.48 (-3.86%) |
6.79 |
6.44 - 6.83 |
0.6563 times |
Fri 21 November 2025 |
6.74 (11.4%) |
6.11 |
6.06 - 6.82 |
2.1318 times |
Thu 20 November 2025 |
6.05 (0%) |
6.24 |
6.04 - 6.56 |
1.538 times |
Wed 19 November 2025 |
6.05 (1.34%) |
5.94 |
5.84 - 6.10 |
0.9331 times |
Weekly price and charts SiriusInternational Strong weekly Stock price targets for SiriusInternational SG are 6.59 and 7.36 | Weekly Target 1 | 5.97 | | Weekly Target 2 | 6.44 | | Weekly Target 3 | 6.74 | | Weekly Target 4 | 7.21 | | Weekly Target 5 | 7.51 |
Weekly price and volumes for Sirius International
| Date |
Closing |
Open |
Range |
Volume |
Thu 04 December 2025 |
6.91 (6.47%) |
6.39 |
6.27 - 7.04 |
0.679 times |
Fri 28 November 2025 |
6.49 (-3.71%) |
6.79 |
6.44 - 6.99 |
0.4819 times |
Fri 21 November 2025 |
6.74 (10.13%) |
6.03 |
5.60 - 6.82 |
1.3228 times |
Fri 14 November 2025 |
6.12 (5.88%) |
5.81 |
5.14 - 6.39 |
1.9862 times |
Fri 07 November 2025 |
5.78 (-8.11%) |
6.62 |
4.95 - 6.62 |
1.5846 times |
Fri 31 October 2025 |
6.29 (0%) |
6.36 |
6.19 - 6.39 |
0.1911 times |
Fri 31 October 2025 |
6.29 (-14.77%) |
7.43 |
6.19 - 7.47 |
1.1651 times |
Fri 24 October 2025 |
7.38 (0.96%) |
7.43 |
7.28 - 8.50 |
1.0331 times |
Fri 17 October 2025 |
7.31 (-5.8%) |
7.61 |
7.23 - 7.92 |
1.0319 times |
Tue 07 October 2025 |
7.76 (-6.28%) |
8.28 |
7.68 - 8.34 |
0.5243 times |
Fri 03 October 2025 |
8.28 (1.6%) |
8.20 |
7.84 - 8.41 |
0.9738 times |
Monthly price and charts SiriusInternational Strong monthly Stock price targets for SiriusInternational SG are 6.59 and 7.36 | Monthly Target 1 | 5.97 | | Monthly Target 2 | 6.44 | | Monthly Target 3 | 6.74 | | Monthly Target 4 | 7.21 | | Monthly Target 5 | 7.51 |
Monthly price and volumes Sirius International
| Date |
Closing |
Open |
Range |
Volume |
Thu 04 December 2025 |
6.91 (6.47%) |
6.39 |
6.27 - 7.04 |
0.1651 times |
Fri 28 November 2025 |
6.49 (3.18%) |
6.62 |
4.95 - 6.99 |
1.3067 times |
Fri 31 October 2025 |
6.29 (-21.18%) |
8.01 |
6.19 - 8.50 |
1.0907 times |
Tue 30 September 2025 |
7.98 (-12.31%) |
9.00 |
7.84 - 9.25 |
1.1317 times |
Fri 29 August 2025 |
9.10 (-29.35%) |
12.61 |
8.45 - 12.88 |
1.4568 times |
Thu 31 July 2025 |
12.88 (-13.44%) |
14.08 |
12.67 - 16.70 |
1.1202 times |
Mon 30 June 2025 |
14.88 (10.88%) |
13.34 |
11.86 - 15.20 |
0.9412 times |
Fri 30 May 2025 |
13.42 (-31.11%) |
19.94 |
12.37 - 21.04 |
1.2597 times |
Wed 30 April 2025 |
19.48 (-22.14%) |
25.16 |
16.29 - 25.88 |
0.8106 times |
Mon 31 March 2025 |
25.02 (9.93%) |
23.06 |
20.06 - 26.85 |
0.7173 times |
Fri 28 February 2025 |
22.76 (-30.86%) |
31.40 |
21.15 - 33.80 |
0.834 times |

DMA SMA EMA moving averages of Sirius International SG
DMA (daily moving average) of Sirius International SG
| DMA period | DMA value | | 5 day DMA | 6.68 | | 12 day DMA | 6.52 | | 20 day DMA | 6.2 | | 35 day DMA | 6.57 | | 50 day DMA | 7.01 | | 100 day DMA | 8.88 | | 150 day DMA | 10.83 | | 200 day DMA | 13.78 | EMA (exponential moving average) of Sirius International SG
| EMA period | EMA current | EMA prev | EMA prev2 | | 5 day EMA | 6.75 | 6.67 | 6.53 | | 12 day EMA | 6.55 | 6.48 | 6.4 | | 20 day EMA | 6.53 | 6.49 | 6.44 | | 35 day EMA | 6.76 | 6.75 | 6.74 | | 50 day EMA | 7.11 | 7.12 | 7.13 |
SMA (simple moving average) of Sirius International SG
| SMA period | SMA current | SMA prev | SMA prev2 | | 5 day SMA | 6.68 | 6.62 | 6.61 | | 12 day SMA | 6.52 | 6.42 | 6.35 | | 20 day SMA | 6.2 | 6.18 | 6.15 | | 35 day SMA | 6.57 | 6.58 | 6.61 | | 50 day SMA | 7.01 | 7.05 | 7.08 | | 100 day SMA | 8.88 | 8.95 | 9.01 | | 150 day SMA | 10.83 | 10.91 | 10.99 | | 200 day SMA | 13.78 | 13.88 | 13.97 |
|
|
