SoundFinancial SFBC full analysis,charts,indicators,moving averages,SMA,DMA,EMA,ADX,MACD,RSISound Financial SFBC WideScreen charts, DMA,SMA,EMA technical analysis, forecast prediction, by indicators ADX,MACD,RSI,CCI USA stock exchange
operates under Finance sector & deals in Savings Institutions
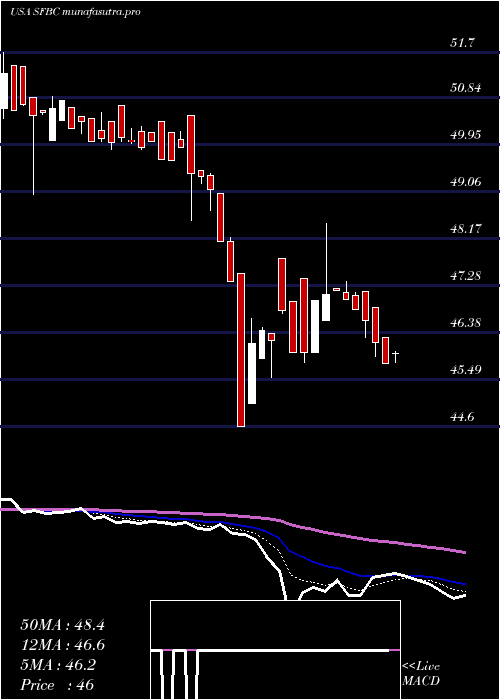
Daily price and charts and targets SoundFinancial Strong Daily Stock price targets for SoundFinancial SFBC are 44.04 and 44.3 | Daily Target 1 | 43.97 | | Daily Target 2 | 44.1 | | Daily Target 3 | 44.23 | | Daily Target 4 | 44.36 | | Daily Target 5 | 44.49 |
Daily price and volume Sound Financial
| Date |
Closing |
Open |
Range |
Volume |
Thu 04 December 2025 |
44.23 (0.55%) |
44.29 |
44.10 - 44.36 |
0.554 times |
Wed 03 December 2025 |
43.99 (0.34%) |
43.99 |
43.99 - 43.99 |
0.5263 times |
Tue 02 December 2025 |
43.84 (-0.41%) |
44.01 |
43.84 - 44.01 |
0.831 times |
Mon 01 December 2025 |
44.02 (-0.65%) |
44.06 |
44.02 - 44.36 |
0.7479 times |
Fri 28 November 2025 |
44.31 (0.18%) |
44.18 |
44.01 - 44.31 |
1.0526 times |
Wed 26 November 2025 |
44.23 (-0.74%) |
44.17 |
44.17 - 44.52 |
1.0526 times |
Tue 25 November 2025 |
44.56 (0.32%) |
44.20 |
44.20 - 44.59 |
1.3573 times |
Mon 24 November 2025 |
44.42 (-1.02%) |
44.57 |
44.25 - 44.98 |
1.4681 times |
Fri 21 November 2025 |
44.88 (1.47%) |
44.25 |
44.25 - 45.00 |
1.8283 times |
Thu 20 November 2025 |
44.23 (0.16%) |
44.44 |
44.20 - 44.44 |
0.5817 times |
Wed 19 November 2025 |
44.16 (-1.3%) |
44.66 |
44.11 - 44.66 |
1.2188 times |
Weekly price and charts SoundFinancial Strong weekly Stock price targets for SoundFinancial SFBC are 44.04 and 44.56 | Weekly Target 1 | 43.62 | | Weekly Target 2 | 43.93 | | Weekly Target 3 | 44.143333333333 | | Weekly Target 4 | 44.45 | | Weekly Target 5 | 44.66 |
Weekly price and volumes for Sound Financial
| Date |
Closing |
Open |
Range |
Volume |
Thu 04 December 2025 |
44.23 (-0.18%) |
44.06 |
43.84 - 44.36 |
0.499 times |
Fri 28 November 2025 |
44.31 (-1.27%) |
44.57 |
44.01 - 44.98 |
0.9252 times |
Fri 21 November 2025 |
44.88 (0.25%) |
44.86 |
44.11 - 45.00 |
0.9927 times |
Fri 14 November 2025 |
44.77 (-0.42%) |
45.48 |
44.66 - 46.00 |
0.894 times |
Fri 07 November 2025 |
44.96 (0.72%) |
45.00 |
43.80 - 45.53 |
0.9563 times |
Fri 31 October 2025 |
44.64 (0%) |
44.25 |
44.20 - 44.64 |
0.1299 times |
Fri 31 October 2025 |
44.64 (-1.39%) |
44.67 |
44.00 - 44.70 |
2.3337 times |
Fri 24 October 2025 |
45.27 (1.12%) |
44.61 |
44.61 - 45.59 |
0.4002 times |
Fri 17 October 2025 |
44.77 (-2.04%) |
45.99 |
44.61 - 46.00 |
1.3669 times |
Fri 10 October 2025 |
45.70 (-1.57%) |
46.50 |
45.66 - 46.50 |
1.5021 times |
Fri 03 October 2025 |
46.43 (-2.74%) |
47.90 |
45.82 - 47.90 |
1.2796 times |
Monthly price and charts SoundFinancial Strong monthly Stock price targets for SoundFinancial SFBC are 44.04 and 44.56 | Monthly Target 1 | 43.62 | | Monthly Target 2 | 43.93 | | Monthly Target 3 | 44.143333333333 | | Monthly Target 4 | 44.45 | | Monthly Target 5 | 44.66 |
Monthly price and volumes Sound Financial
| Date |
Closing |
Open |
Range |
Volume |
Thu 04 December 2025 |
44.23 (-0.18%) |
44.06 |
43.84 - 44.36 |
0.0815 times |
Fri 28 November 2025 |
44.31 (-0.74%) |
45.00 |
43.80 - 46.00 |
0.6153 times |
Fri 31 October 2025 |
44.64 (-3.08%) |
46.03 |
44.00 - 46.50 |
1.0856 times |
Tue 30 September 2025 |
46.06 (-2.56%) |
47.15 |
45.12 - 47.90 |
0.7977 times |
Fri 29 August 2025 |
47.27 (2.65%) |
45.95 |
45.75 - 48.85 |
0.8639 times |
Thu 31 July 2025 |
46.05 (0.11%) |
46.01 |
44.00 - 48.50 |
1.2819 times |
Mon 30 June 2025 |
46.00 (-7.98%) |
50.69 |
44.60 - 50.69 |
3.7263 times |
Fri 30 May 2025 |
49.99 (-1.54%) |
50.77 |
49.00 - 51.70 |
0.7222 times |
Wed 30 April 2025 |
50.77 (1.24%) |
50.73 |
47.18 - 51.90 |
0.5903 times |
Mon 31 March 2025 |
50.15 (-0.63%) |
49.45 |
48.78 - 51.99 |
0.2353 times |
Fri 28 February 2025 |
50.47 (-4.52%) |
52.07 |
48.71 - 52.75 |
0.2172 times |
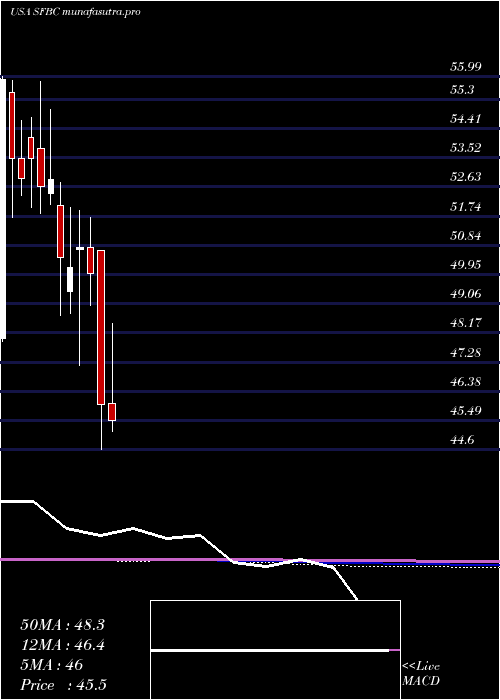
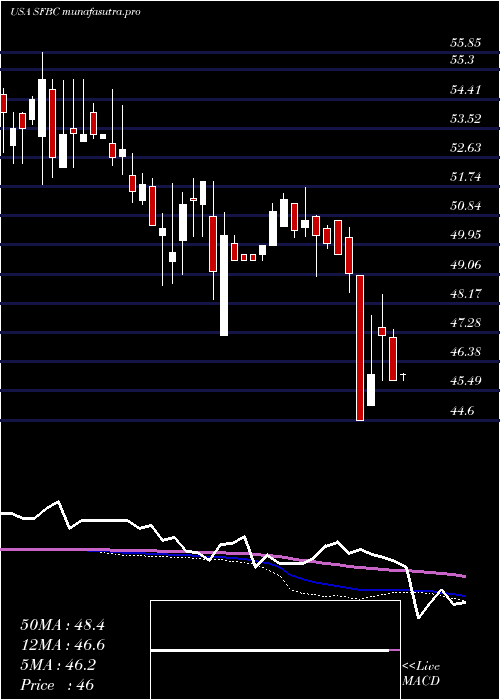
DMA SMA EMA moving averages of Sound Financial SFBC
DMA (daily moving average) of Sound Financial SFBC
| DMA period | DMA value | | 5 day DMA | 44.08 | | 12 day DMA | 44.3 | | 20 day DMA | 44.54 | | 35 day DMA | 44.64 | | 50 day DMA | 45.11 | | 100 day DMA | 45.88 | | 150 day DMA | 46.87 | | 200 day DMA | 47.76 | EMA (exponential moving average) of Sound Financial SFBC
| EMA period | EMA current | EMA prev | EMA prev2 | | 5 day EMA | 44.13 | 44.08 | 44.13 | | 12 day EMA | 44.29 | 44.3 | 44.36 | | 20 day EMA | 44.46 | 44.48 | 44.53 | | 35 day EMA | 44.82 | 44.85 | 44.9 | | 50 day EMA | 45.1 | 45.14 | 45.19 |
SMA (simple moving average) of Sound Financial SFBC
| SMA period | SMA current | SMA prev | SMA prev2 | | 5 day SMA | 44.08 | 44.08 | 44.19 | | 12 day SMA | 44.3 | 44.35 | 44.41 | | 20 day SMA | 44.54 | 44.58 | 44.57 | | 35 day SMA | 44.64 | 44.69 | 44.74 | | 50 day SMA | 45.11 | 45.15 | 45.19 | | 100 day SMA | 45.88 | 45.89 | 45.91 | | 150 day SMA | 46.87 | 46.91 | 46.96 | | 200 day SMA | 47.76 | 47.8 | 47.83 |
|
|
