SynthesisEnergy SES full analysis,charts,indicators,moving averages,SMA,DMA,EMA,ADX,MACD,RSISynthesis Energy SES WideScreen charts, DMA,SMA,EMA technical analysis, forecast prediction, by indicators ADX,MACD,RSI,CCI USA stock exchange
operates under Basic Industries sector & deals in Major Chemicals
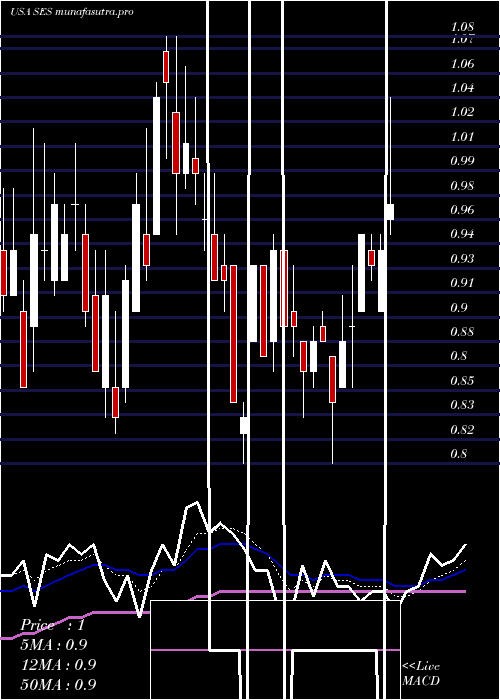
Daily price and charts and targets SynthesisEnergy Strong Daily Stock price targets for SynthesisEnergy SES are 2.12 and 2.54 | Daily Target 1 | 1.78 | | Daily Target 2 | 2.03 | | Daily Target 3 | 2.1966666666667 | | Daily Target 4 | 2.45 | | Daily Target 5 | 2.62 |
Daily price and volume Synthesis Energy
| Date |
Closing |
Open |
Range |
Volume |
Thu 04 December 2025 |
2.29 (14.5%) |
2.00 |
1.94 - 2.36 |
1.3678 times |
Wed 03 December 2025 |
2.00 (8.7%) |
1.85 |
1.79 - 2.00 |
0.8006 times |
Tue 02 December 2025 |
1.84 (-1.6%) |
1.89 |
1.82 - 1.99 |
0.816 times |
Mon 01 December 2025 |
1.87 (-5.08%) |
1.91 |
1.84 - 1.94 |
1.2681 times |
Fri 28 November 2025 |
1.97 (5.35%) |
1.92 |
1.91 - 2.04 |
0.9259 times |
Wed 26 November 2025 |
1.87 (-0.53%) |
1.88 |
1.84 - 1.92 |
0.5251 times |
Tue 25 November 2025 |
1.88 (1.08%) |
1.92 |
1.76 - 1.94 |
0.4956 times |
Mon 24 November 2025 |
1.86 (2.76%) |
1.87 |
1.81 - 1.91 |
0.7278 times |
Fri 21 November 2025 |
1.81 (0.56%) |
1.82 |
1.66 - 1.82 |
1.5991 times |
Thu 20 November 2025 |
1.80 (-1.64%) |
1.91 |
1.79 - 2.05 |
1.474 times |
Wed 19 November 2025 |
1.83 (-1.08%) |
1.86 |
1.82 - 1.93 |
0.8929 times |
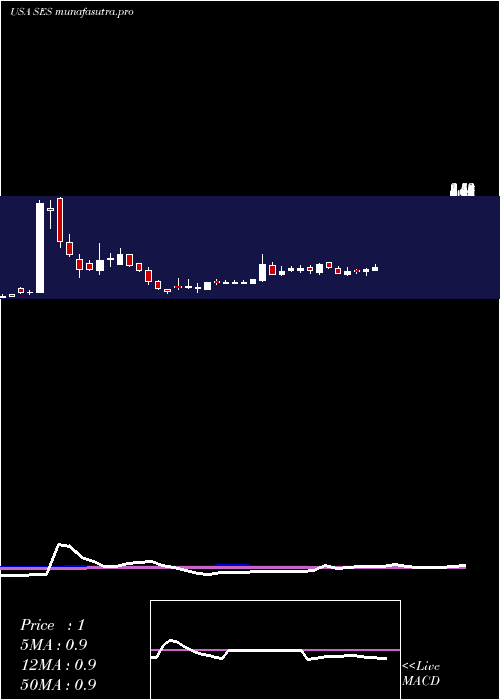
Weekly price and charts SynthesisEnergy Strong weekly Stock price targets for SynthesisEnergy SES are 2.04 and 2.61 | Weekly Target 1 | 1.58 | | Weekly Target 2 | 1.93 | | Weekly Target 3 | 2.1466666666667 | | Weekly Target 4 | 2.5 | | Weekly Target 5 | 2.72 |
Weekly price and volumes for Synthesis Energy
| Date |
Closing |
Open |
Range |
Volume |
Thu 04 December 2025 |
2.29 (16.24%) |
1.91 |
1.79 - 2.36 |
0.4493 times |
Fri 28 November 2025 |
1.97 (8.84%) |
1.87 |
1.76 - 2.04 |
0.2826 times |
Fri 21 November 2025 |
1.81 (-9.05%) |
1.95 |
1.66 - 2.05 |
0.6407 times |
Fri 14 November 2025 |
1.99 (-21.96%) |
2.58 |
1.80 - 2.61 |
0.6628 times |
Fri 07 November 2025 |
2.55 (8.05%) |
2.22 |
2.01 - 2.62 |
0.9253 times |
Fri 31 October 2025 |
2.36 (0%) |
2.15 |
2.15 - 2.40 |
0.2149 times |
Fri 31 October 2025 |
2.36 (-7.09%) |
2.64 |
2.10 - 2.64 |
0.8911 times |
Fri 24 October 2025 |
2.54 (-17.26%) |
3.18 |
2.33 - 3.36 |
1.3404 times |
Fri 17 October 2025 |
3.07 (13.28%) |
3.24 |
2.85 - 3.73 |
3.4011 times |
Tue 07 October 2025 |
2.71 (30.92%) |
2.22 |
2.08 - 3.05 |
1.1917 times |
Fri 03 October 2025 |
2.07 (11.29%) |
1.85 |
1.57 - 2.10 |
1.0648 times |
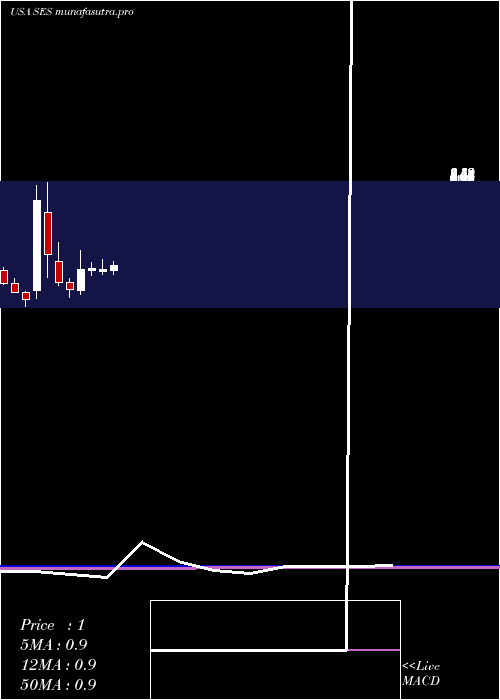
Monthly price and charts SynthesisEnergy Strong monthly Stock price targets for SynthesisEnergy SES are 2.04 and 2.61 | Monthly Target 1 | 1.58 | | Monthly Target 2 | 1.93 | | Monthly Target 3 | 2.1466666666667 | | Monthly Target 4 | 2.5 | | Monthly Target 5 | 2.72 |
Monthly price and volumes Synthesis Energy
| Date |
Closing |
Open |
Range |
Volume |
Thu 04 December 2025 |
2.29 (16.24%) |
1.91 |
1.79 - 2.36 |
0.1087 times |
Fri 28 November 2025 |
1.97 (-16.53%) |
2.22 |
1.66 - 2.62 |
0.6078 times |
Fri 31 October 2025 |
2.36 (41.32%) |
1.67 |
1.65 - 3.73 |
1.8685 times |
Tue 30 September 2025 |
1.67 (53.21%) |
1.08 |
1.03 - 2.17 |
0.8954 times |
Fri 29 August 2025 |
1.09 (-16.15%) |
1.20 |
0.99 - 1.26 |
0.4419 times |
Thu 31 July 2025 |
1.30 (46.07%) |
0.88 |
0.80 - 1.45 |
0.7644 times |
Mon 30 June 2025 |
0.89 (-2.2%) |
0.85 |
0.80 - 1.08 |
0.7389 times |
Fri 30 May 2025 |
0.91 (1.11%) |
0.88 |
0.78 - 1.02 |
1.0633 times |
Wed 30 April 2025 |
0.90 (73.08%) |
0.51 |
0.42 - 1.25 |
1.3187 times |
Mon 31 March 2025 |
0.52 (-21.21%) |
0.66 |
0.38 - 0.72 |
2.1922 times |
Fri 28 February 2025 |
0.66 (-44.07%) |
1.04 |
0.59 - 1.40 |
1.2289 times |
DMA SMA EMA moving averages of Synthesis Energy SES
DMA (daily moving average) of Synthesis Energy SES
| DMA period | DMA value | | 5 day DMA | 1.99 | | 12 day DMA | 1.91 | | 20 day DMA | 2.02 | | 35 day DMA | 2.24 | | 50 day DMA | 2.24 | | 100 day DMA | 1.69 | | 150 day DMA | 1.43 | | 200 day DMA | 1.24 | EMA (exponential moving average) of Synthesis Energy SES
| EMA period | EMA current | EMA prev | EMA prev2 | | 5 day EMA | 2.04 | 1.91 | 1.87 | | 12 day EMA | 1.99 | 1.93 | 1.92 | | 20 day EMA | 2.02 | 1.99 | 1.99 | | 35 day EMA | 2.08 | 2.07 | 2.07 | | 50 day EMA | 2.15 | 2.14 | 2.15 |
SMA (simple moving average) of Synthesis Energy SES
| SMA period | SMA current | SMA prev | SMA prev2 | | 5 day SMA | 1.99 | 1.91 | 1.89 | | 12 day SMA | 1.91 | 1.87 | 1.87 | | 20 day SMA | 2.02 | 2.02 | 2.02 | | 35 day SMA | 2.24 | 2.27 | 2.31 | | 50 day SMA | 2.24 | 2.22 | 2.22 | | 100 day SMA | 1.69 | 1.68 | 1.67 | | 150 day SMA | 1.43 | 1.42 | 1.42 | | 200 day SMA | 1.24 | 1.23 | 1.22 |
|
|
