SeiInvestments SEIC full analysis,charts,indicators,moving averages,SMA,DMA,EMA,ADX,MACD,RSISei Investments SEIC WideScreen charts, DMA,SMA,EMA technical analysis, forecast prediction, by indicators ADX,MACD,RSI,CCI USA stock exchange
operates under Finance sector & deals in Investment Bankers Brokers Service
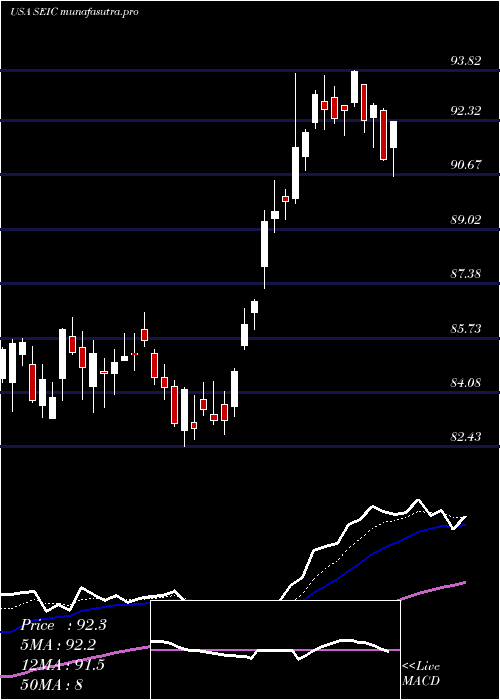
Daily price and charts and targets SeiInvestments Strong Daily Stock price targets for SeiInvestments SEIC are 81.06 and 82.38 | Daily Target 1 | 80.11 | | Daily Target 2 | 80.68 | | Daily Target 3 | 81.43 | | Daily Target 4 | 82 | | Daily Target 5 | 82.75 |
Daily price and volume Sei Investments
| Date |
Closing |
Open |
Range |
Volume |
Thu 04 December 2025 |
81.25 (0.31%) |
81.13 |
80.86 - 82.18 |
1.0293 times |
Wed 03 December 2025 |
81.00 (1.3%) |
80.00 |
80.00 - 81.07 |
1 times |
Tue 02 December 2025 |
79.96 (-0.03%) |
80.01 |
79.69 - 80.73 |
0.8525 times |
Mon 01 December 2025 |
79.98 (-1.09%) |
80.36 |
79.86 - 81.34 |
0.7752 times |
Fri 28 November 2025 |
80.86 (0.04%) |
81.32 |
80.60 - 81.62 |
0.4694 times |
Wed 26 November 2025 |
80.83 (0.79%) |
80.19 |
80.19 - 81.55 |
0.8851 times |
Tue 25 November 2025 |
80.20 (1.08%) |
79.64 |
79.54 - 80.57 |
0.8853 times |
Mon 24 November 2025 |
79.34 (-0.87%) |
79.89 |
79.15 - 80.05 |
1.423 times |
Fri 21 November 2025 |
80.04 (1.56%) |
79.10 |
78.64 - 80.35 |
1.4651 times |
Thu 20 November 2025 |
78.81 (0.46%) |
79.23 |
77.51 - 80.00 |
1.215 times |
Wed 19 November 2025 |
78.45 (0.23%) |
78.37 |
77.65 - 78.71 |
1.1851 times |
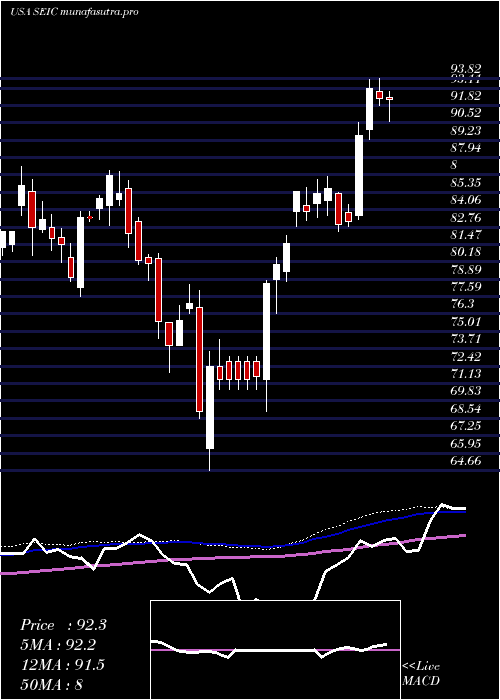
Weekly price and charts SeiInvestments Strong weekly Stock price targets for SeiInvestments SEIC are 80.47 and 82.96 | Weekly Target 1 | 78.55 | | Weekly Target 2 | 79.9 | | Weekly Target 3 | 81.04 | | Weekly Target 4 | 82.39 | | Weekly Target 5 | 83.53 |
Weekly price and volumes for Sei Investments
| Date |
Closing |
Open |
Range |
Volume |
Thu 04 December 2025 |
81.25 (0.48%) |
80.36 |
79.69 - 82.18 |
0.693 times |
Fri 28 November 2025 |
80.86 (1.02%) |
79.89 |
79.15 - 81.62 |
0.6941 times |
Fri 21 November 2025 |
80.04 (-1.88%) |
81.19 |
77.51 - 81.30 |
1.2181 times |
Fri 14 November 2025 |
81.57 (-1.63%) |
83.09 |
80.45 - 84.69 |
0.987 times |
Fri 07 November 2025 |
82.92 (2.87%) |
80.10 |
80.01 - 83.21 |
0.7802 times |
Fri 31 October 2025 |
80.61 (0%) |
80.75 |
80.43 - 81.05 |
0.2648 times |
Fri 31 October 2025 |
80.61 (-1.59%) |
83.20 |
80.07 - 83.88 |
1.2033 times |
Fri 24 October 2025 |
81.91 (1.39%) |
81.26 |
78.34 - 83.21 |
1.5629 times |
Fri 17 October 2025 |
80.79 (-0.53%) |
81.57 |
80.08 - 84.40 |
1.3029 times |
Fri 10 October 2025 |
81.22 (-5.14%) |
85.77 |
81.10 - 86.14 |
1.2936 times |
Fri 03 October 2025 |
85.62 (-0.09%) |
86.29 |
83.47 - 86.43 |
1.2554 times |
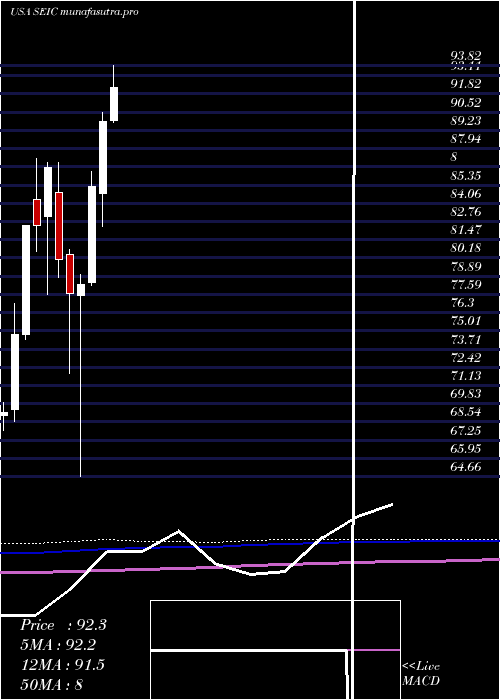
Monthly price and charts SeiInvestments Strong monthly Stock price targets for SeiInvestments SEIC are 80.47 and 82.96 | Monthly Target 1 | 78.55 | | Monthly Target 2 | 79.9 | | Monthly Target 3 | 81.04 | | Monthly Target 4 | 82.39 | | Monthly Target 5 | 83.53 |
Monthly price and volumes Sei Investments
| Date |
Closing |
Open |
Range |
Volume |
Thu 04 December 2025 |
81.25 (0.48%) |
80.36 |
79.69 - 82.18 |
0.1187 times |
Fri 28 November 2025 |
80.86 (0.31%) |
80.10 |
77.51 - 84.69 |
0.63 times |
Fri 31 October 2025 |
80.61 (-5%) |
84.50 |
78.34 - 86.14 |
1.1026 times |
Tue 30 September 2025 |
84.85 (-3.89%) |
87.29 |
84.23 - 89.52 |
1.0488 times |
Fri 29 August 2025 |
88.28 (0.18%) |
86.83 |
85.55 - 90.97 |
0.7935 times |
Thu 31 July 2025 |
88.12 (-1.94%) |
89.96 |
86.20 - 93.96 |
1.3548 times |
Mon 30 June 2025 |
89.86 (5.4%) |
84.73 |
82.43 - 90.52 |
1.2453 times |
Fri 30 May 2025 |
85.26 (8.9%) |
78.46 |
78.21 - 86.34 |
1.5726 times |
Wed 30 April 2025 |
78.29 (0.85%) |
77.50 |
64.66 - 79.03 |
1.082 times |
Mon 31 March 2025 |
77.63 (-3.02%) |
80.45 |
71.97 - 80.80 |
1.0517 times |
Fri 28 February 2025 |
80.05 (-7.54%) |
84.79 |
78.81 - 86.92 |
0.6967 times |
DMA SMA EMA moving averages of Sei Investments SEIC
DMA (daily moving average) of Sei Investments SEIC
| DMA period | DMA value | | 5 day DMA | 80.61 | | 12 day DMA | 79.92 | | 20 day DMA | 80.85 | | 35 day DMA | 81.11 | | 50 day DMA | 82.06 | | 100 day DMA | 85.24 | | 150 day DMA | 85.44 | | 200 day DMA | 82.9 | EMA (exponential moving average) of Sei Investments SEIC
| EMA period | EMA current | EMA prev | EMA prev2 | | 5 day EMA | 80.7 | 80.43 | 80.14 | | 12 day EMA | 80.54 | 80.41 | 80.3 | | 20 day EMA | 80.76 | 80.71 | 80.68 | | 35 day EMA | 81.51 | 81.53 | 81.56 | | 50 day EMA | 82.28 | 82.32 | 82.37 |
SMA (simple moving average) of Sei Investments SEIC
| SMA period | SMA current | SMA prev | SMA prev2 | | 5 day SMA | 80.61 | 80.53 | 80.37 | | 12 day SMA | 79.92 | 79.71 | 79.76 | | 20 day SMA | 80.85 | 80.91 | 80.94 | | 35 day SMA | 81.11 | 81.15 | 81.22 | | 50 day SMA | 82.06 | 82.15 | 82.26 | | 100 day SMA | 85.24 | 85.34 | 85.46 | | 150 day SMA | 85.44 | 85.42 | 85.4 | | 200 day SMA | 82.9 | 82.9 | 82.91 |
|
|
