Sea SE full analysis,charts,indicators,moving averages,SMA,DMA,EMA,ADX,MACD,RSISea SE WideScreen charts, DMA,SMA,EMA technical analysis, forecast prediction, by indicators ADX,MACD,RSI,CCI USA stock exchange
operates under Consumer Services sector & deals in Other Consumer Services
Daily price and charts and targets Sea Strong Daily Stock price targets for Sea SE are 133.81 and 137.32 | Daily Target 1 | 130.94 | | Daily Target 2 | 133.17 | | Daily Target 3 | 134.44666666667 | | Daily Target 4 | 136.68 | | Daily Target 5 | 137.96 |
Daily price and volume Sea
| Date |
Closing |
Open |
Range |
Volume |
Thu 04 December 2025 |
135.41 (0.27%) |
134.66 |
132.21 - 135.72 |
0.6285 times |
Wed 03 December 2025 |
135.04 (-2.02%) |
137.20 |
134.58 - 137.23 |
0.7756 times |
Tue 02 December 2025 |
137.83 (1.88%) |
135.27 |
133.50 - 138.47 |
0.8311 times |
Mon 01 December 2025 |
135.28 (-2.68%) |
138.32 |
135.06 - 138.68 |
0.9664 times |
Fri 28 November 2025 |
139.01 (3.53%) |
136.39 |
135.63 - 140.05 |
0.6054 times |
Wed 26 November 2025 |
134.27 (-1.51%) |
137.10 |
134.19 - 140.41 |
0.6197 times |
Tue 25 November 2025 |
136.33 (-0.1%) |
135.98 |
132.71 - 136.73 |
0.6519 times |
Mon 24 November 2025 |
136.47 (3.91%) |
132.88 |
130.67 - 136.93 |
0.7587 times |
Fri 21 November 2025 |
131.34 (0.27%) |
131.28 |
127.83 - 133.94 |
1.7873 times |
Thu 20 November 2025 |
130.99 (-8.74%) |
145.27 |
130.44 - 145.27 |
2.3754 times |
Wed 19 November 2025 |
143.53 (-2.53%) |
146.50 |
143.24 - 147.34 |
0.8337 times |
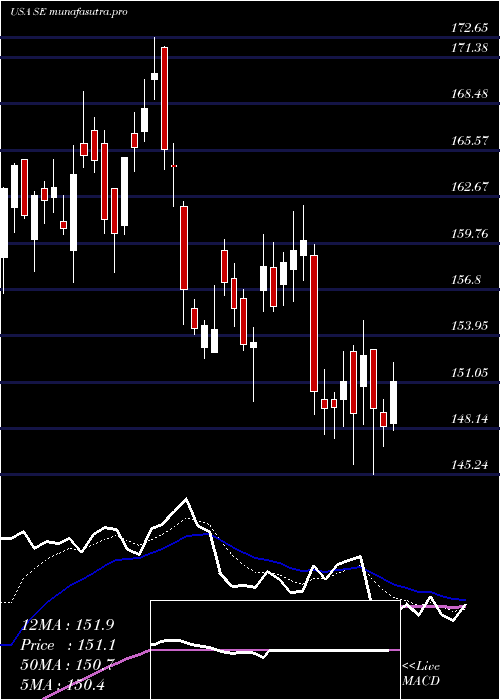
Weekly price and charts Sea Strong weekly Stock price targets for Sea SE are 130.58 and 137.05 | Weekly Target 1 | 128.96 | | Weekly Target 2 | 132.19 | | Weekly Target 3 | 135.43333333333 | | Weekly Target 4 | 138.66 | | Weekly Target 5 | 141.9 |
Weekly price and volumes for Sea
| Date |
Closing |
Open |
Range |
Volume |
Thu 04 December 2025 |
135.41 (-2.59%) |
138.32 |
132.21 - 138.68 |
0.748 times |
Fri 28 November 2025 |
139.01 (5.84%) |
132.88 |
130.67 - 140.41 |
0.6158 times |
Fri 21 November 2025 |
131.34 (-6.75%) |
145.14 |
127.83 - 148.08 |
1.6896 times |
Fri 14 November 2025 |
140.85 (-6.1%) |
152.80 |
134.51 - 159.09 |
2.1242 times |
Fri 07 November 2025 |
150.00 (-4%) |
155.25 |
145.79 - 159.80 |
0.7645 times |
Fri 31 October 2025 |
156.25 (0%) |
156.50 |
154.81 - 157.43 |
0.1705 times |
Fri 31 October 2025 |
156.25 (1.05%) |
157.83 |
152.80 - 164.03 |
1.0244 times |
Fri 24 October 2025 |
154.62 (-3.4%) |
163.94 |
154.23 - 171.09 |
0.8217 times |
Fri 17 October 2025 |
160.06 (-16.2%) |
181.15 |
158.84 - 184.96 |
1.786 times |
Tue 07 October 2025 |
191.01 (3.3%) |
186.01 |
184.96 - 191.32 |
0.2553 times |
Fri 03 October 2025 |
184.91 (0.18%) |
186.13 |
176.26 - 188.77 |
0.9086 times |
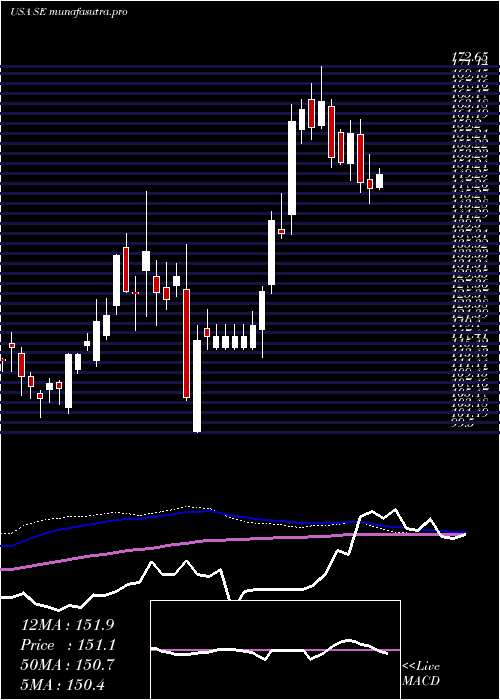
Monthly price and charts Sea Strong monthly Stock price targets for Sea SE are 130.58 and 137.05 | Monthly Target 1 | 128.96 | | Monthly Target 2 | 132.19 | | Monthly Target 3 | 135.43333333333 | | Monthly Target 4 | 138.66 | | Monthly Target 5 | 141.9 |
Monthly price and volumes Sea
| Date |
Closing |
Open |
Range |
Volume |
Thu 04 December 2025 |
135.41 (-2.59%) |
138.32 |
132.21 - 138.68 |
0.159 times |
Fri 28 November 2025 |
139.01 (-11.03%) |
155.25 |
127.83 - 159.80 |
1.1041 times |
Fri 31 October 2025 |
156.25 (-12.58%) |
179.00 |
152.80 - 191.32 |
0.9624 times |
Tue 30 September 2025 |
178.73 (-4.19%) |
181.63 |
173.00 - 199.30 |
0.851 times |
Fri 29 August 2025 |
186.54 (19.08%) |
153.54 |
145.63 - 190.75 |
1.2277 times |
Thu 31 July 2025 |
156.65 (-2.06%) |
159.00 |
145.24 - 170.00 |
1.0409 times |
Mon 30 June 2025 |
159.94 (-0.27%) |
160.84 |
149.84 - 172.65 |
0.8321 times |
Fri 30 May 2025 |
160.37 (19.63%) |
136.19 |
135.66 - 169.28 |
1.198 times |
Wed 30 April 2025 |
134.05 (2.73%) |
129.25 |
99.50 - 137.00 |
1.3915 times |
Mon 31 March 2025 |
130.49 (2.53%) |
131.85 |
120.81 - 147.73 |
1.2333 times |
Fri 28 February 2025 |
127.27 (4.5%) |
119.00 |
118.20 - 139.18 |
0.8793 times |
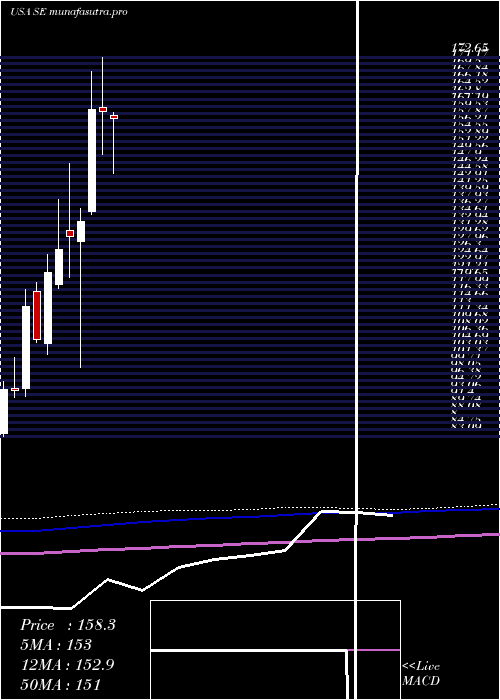
DMA SMA EMA moving averages of Sea SE
DMA (daily moving average) of Sea SE
| DMA period | DMA value | | 5 day DMA | 136.51 | | 12 day DMA | 136.9 | | 20 day DMA | 140.68 | | 35 day DMA | 148.36 | | 50 day DMA | 158.91 | | 100 day DMA | 165.96 | | 150 day DMA | 162.13 | | 200 day DMA | 152.89 | EMA (exponential moving average) of Sea SE
| EMA period | EMA current | EMA prev | EMA prev2 | | 5 day EMA | 135.98 | 136.27 | 136.88 | | 12 day EMA | 137.94 | 138.4 | 139.01 | | 20 day EMA | 141.65 | 142.31 | 143.08 | | 35 day EMA | 150.16 | 151.03 | 151.97 | | 50 day EMA | 159.22 | 160.19 | 161.22 |
SMA (simple moving average) of Sea SE
| SMA period | SMA current | SMA prev | SMA prev2 | | 5 day SMA | 136.51 | 136.29 | 136.54 | | 12 day SMA | 136.9 | 137.76 | 138.24 | | 20 day SMA | 140.68 | 141.8 | 142.87 | | 35 day SMA | 148.36 | 149.16 | 150.46 | | 50 day SMA | 158.91 | 160.06 | 161.17 | | 100 day SMA | 165.96 | 166.1 | 166.27 | | 150 day SMA | 162.13 | 162.08 | 162.01 | | 200 day SMA | 152.89 | 152.89 | 152.88 |
|
|
