ScansourceInc SCSC full analysis,charts,indicators,moving averages,SMA,DMA,EMA,ADX,MACD,RSIScansource Inc SCSC WideScreen charts, DMA,SMA,EMA technical analysis, forecast prediction, by indicators ADX,MACD,RSI,CCI USA stock exchange
operates under Technology sector & deals in Retail Computer Software Peripheral Equipment
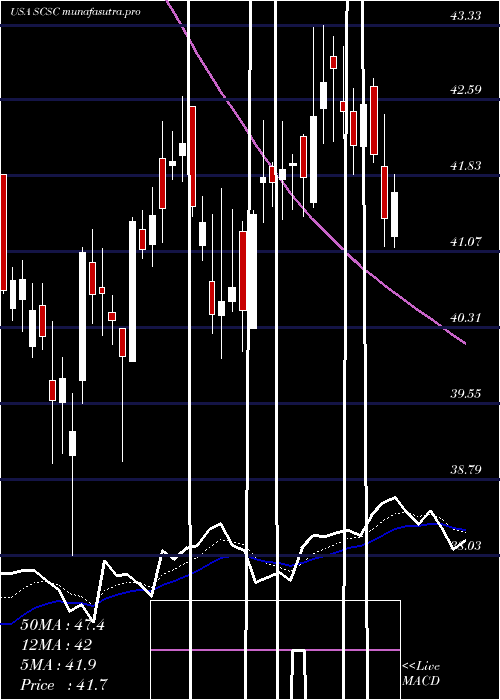
Daily price and charts and targets ScansourceInc Strong Daily Stock price targets for ScansourceInc SCSC are 42.64 and 43.52 | Daily Target 1 | 41.94 | | Daily Target 2 | 42.45 | | Daily Target 3 | 42.823333333333 | | Daily Target 4 | 43.33 | | Daily Target 5 | 43.7 |
Daily price and volume Scansource Inc
| Date |
Closing |
Open |
Range |
Volume |
Tue 21 October 2025 |
42.95 (0.75%) |
42.32 |
42.32 - 43.20 |
0.6483 times |
Mon 20 October 2025 |
42.63 (2.5%) |
42.02 |
41.92 - 42.77 |
0.6363 times |
Fri 17 October 2025 |
41.59 (-0.1%) |
41.56 |
41.32 - 41.93 |
0.866 times |
Thu 16 October 2025 |
41.63 (-2.3%) |
42.61 |
41.62 - 42.87 |
1.0609 times |
Wed 15 October 2025 |
42.61 (1.31%) |
42.61 |
42.27 - 43.47 |
1.2544 times |
Tue 14 October 2025 |
42.06 (2.06%) |
40.70 |
40.70 - 42.28 |
1.036 times |
Mon 13 October 2025 |
41.21 (-0.7%) |
41.10 |
40.63 - 41.50 |
0.7115 times |
Tue 07 October 2025 |
41.50 (-2.83%) |
42.79 |
41.45 - 43.23 |
0.9238 times |
Mon 06 October 2025 |
42.71 (-3.17%) |
44.38 |
42.56 - 44.60 |
1.7979 times |
Fri 03 October 2025 |
44.11 (0.68%) |
44.00 |
44.00 - 44.77 |
1.0649 times |
Thu 02 October 2025 |
43.81 (-0.02%) |
43.89 |
43.13 - 44.23 |
0.5902 times |
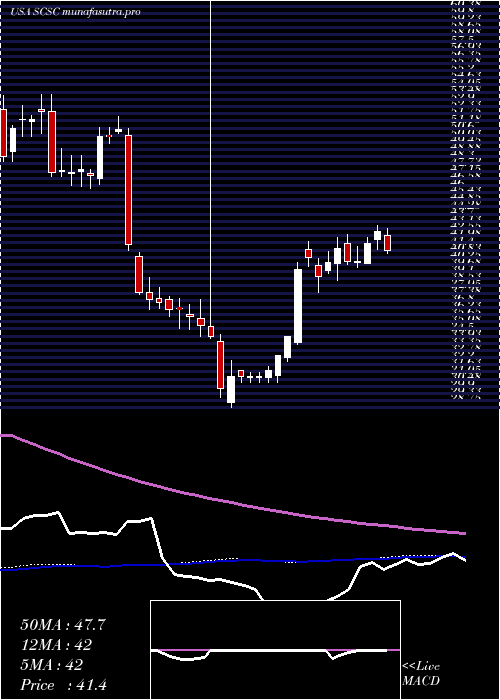
Weekly price and charts ScansourceInc Strong weekly Stock price targets for ScansourceInc SCSC are 42.44 and 43.72 | Weekly Target 1 | 41.41 | | Weekly Target 2 | 42.18 | | Weekly Target 3 | 42.69 | | Weekly Target 4 | 43.46 | | Weekly Target 5 | 43.97 |
Weekly price and volumes for Scansource Inc
| Date |
Closing |
Open |
Range |
Volume |
Tue 21 October 2025 |
42.95 (3.27%) |
42.02 |
41.92 - 43.20 |
0.2166 times |
Fri 17 October 2025 |
41.59 (0.22%) |
41.10 |
40.63 - 43.47 |
0.8311 times |
Tue 07 October 2025 |
41.50 (-5.92%) |
44.38 |
41.45 - 44.60 |
0.4589 times |
Fri 03 October 2025 |
44.11 (-0.2%) |
44.39 |
43.01 - 44.77 |
0.8122 times |
Fri 26 September 2025 |
44.20 (0.91%) |
43.74 |
43.21 - 45.35 |
1.1626 times |
Fri 19 September 2025 |
43.80 (-1.57%) |
45.03 |
43.60 - 45.73 |
1.7807 times |
Fri 12 September 2025 |
44.50 (-0.93%) |
45.38 |
42.57 - 45.61 |
1.5854 times |
Fri 05 September 2025 |
44.92 (2.91%) |
43.06 |
42.86 - 46.25 |
1.2274 times |
Fri 29 August 2025 |
43.65 (0%) |
44.36 |
43.36 - 44.98 |
0.2287 times |
Fri 29 August 2025 |
43.65 (-2.2%) |
44.63 |
43.27 - 45.24 |
1.6965 times |
Fri 22 August 2025 |
44.63 (4.77%) |
42.65 |
39.60 - 44.93 |
2.5987 times |
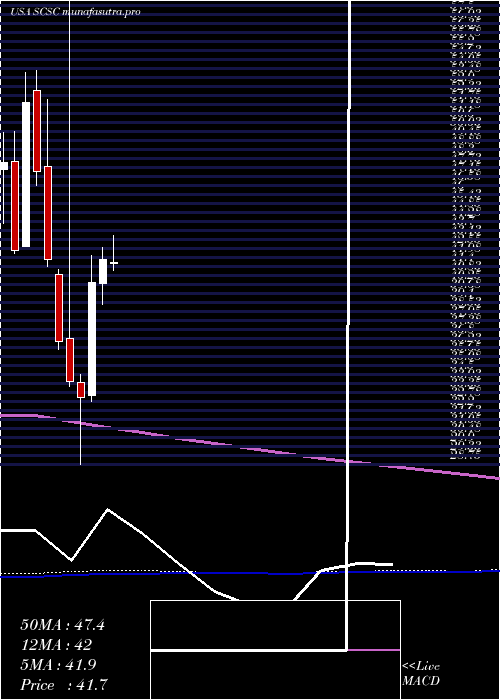
Monthly price and charts ScansourceInc Strong monthly Stock price targets for ScansourceInc SCSC are 39.72 and 43.86 | Monthly Target 1 | 38.64 | | Monthly Target 2 | 40.8 | | Monthly Target 3 | 42.783333333333 | | Monthly Target 4 | 44.94 | | Monthly Target 5 | 46.92 |
Monthly price and volumes Scansource Inc
| Date |
Closing |
Open |
Range |
Volume |
Tue 21 October 2025 |
42.95 (-2.36%) |
43.64 |
40.63 - 44.77 |
0.3672 times |
Tue 30 September 2025 |
43.99 (0.78%) |
43.06 |
42.57 - 46.25 |
1.1411 times |
Fri 29 August 2025 |
43.65 (12.38%) |
38.42 |
37.72 - 45.63 |
1.4107 times |
Thu 31 July 2025 |
38.84 (-7.1%) |
41.56 |
38.38 - 43.33 |
0.9665 times |
Mon 30 June 2025 |
41.81 (3.54%) |
40.30 |
38.97 - 42.62 |
0.8121 times |
Fri 30 May 2025 |
40.38 (22.4%) |
33.11 |
32.76 - 42.08 |
1.0414 times |
Wed 30 April 2025 |
32.99 (-3%) |
33.99 |
28.75 - 34.48 |
0.9178 times |
Mon 31 March 2025 |
34.01 (-7.1%) |
36.75 |
33.68 - 3536.18 |
1.4674 times |
Fri 28 February 2025 |
36.61 (-12.52%) |
40.87 |
36.05 - 41.21 |
1.0077 times |
Fri 31 January 2025 |
41.85 (-11.8%) |
47.79 |
41.36 - 52.06 |
0.8682 times |
Tue 31 December 2024 |
47.45 (-8.52%) |
52.62 |
46.56 - 53.90 |
0.9869 times |
DMA SMA EMA moving averages of Scansource Inc SCSC
DMA (daily moving average) of Scansource Inc SCSC
| DMA period | DMA value | | 5 day DMA | 42.28 | | 12 day DMA | 42.55 | | 20 day DMA | 43.18 | | 35 day DMA | 43.64 | | 50 day DMA | 43.5 | | 100 day DMA | 42.27 | | 150 day DMA | 63.01 | | 200 day DMA | 57.89 | EMA (exponential moving average) of Scansource Inc SCSC
| EMA period | EMA current | EMA prev | EMA prev2 | | 5 day EMA | 42.43 | 42.17 | 41.94 | | 12 day EMA | 42.62 | 42.56 | 42.55 | | 20 day EMA | 42.9 | 42.89 | 42.92 | | 35 day EMA | 42.96 | 42.96 | 42.98 | | 50 day EMA | 43 | 43 | 43.02 |
SMA (simple moving average) of Scansource Inc SCSC
| SMA period | SMA current | SMA prev | SMA prev2 | | 5 day SMA | 42.28 | 42.1 | 41.82 | | 12 day SMA | 42.55 | 42.64 | 42.77 | | 20 day SMA | 43.18 | 43.25 | 43.31 | | 35 day SMA | 43.64 | 43.68 | 43.74 | | 50 day SMA | 43.5 | 43.44 | 43.38 | | 100 day SMA | 42.27 | 42.24 | 42.21 | | 150 day SMA | 63.01 | 62.96 | 62.92 | | 200 day SMA | 57.89 | 57.91 | 57.93 |
|
|
