StellusCapital SCM full analysis,charts,indicators,moving averages,SMA,DMA,EMA,ADX,MACD,RSIStellus Capital SCM WideScreen charts, DMA,SMA,EMA technical analysis, forecast prediction, by indicators ADX,MACD,RSI,CCI USA stock exchange
operates under N A sector & deals in N A
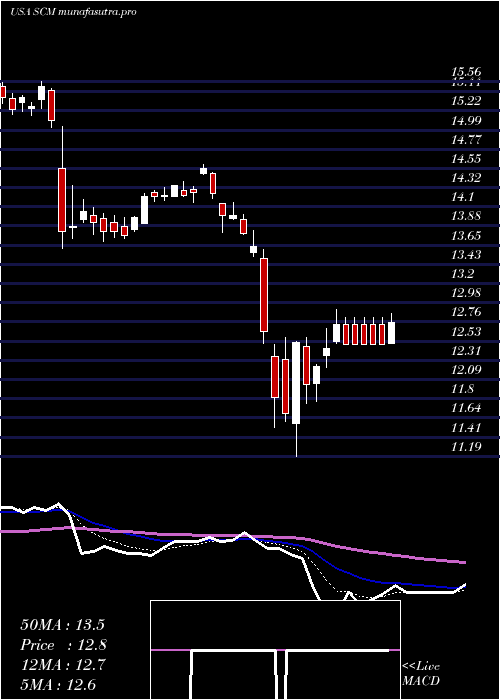
Daily price and charts and targets StellusCapital Strong Daily Stock price targets for StellusCapital SCM are 12.04 and 12.25 | Daily Target 1 | 11.87 | | Daily Target 2 | 11.99 | | Daily Target 3 | 12.076666666667 | | Daily Target 4 | 12.2 | | Daily Target 5 | 12.29 |
Daily price and volume Stellus Capital
| Date |
Closing |
Open |
Range |
Volume |
Mon 20 October 2025 |
12.12 (1%) |
12.01 |
11.95 - 12.16 |
0.6274 times |
Fri 17 October 2025 |
12.00 (0.93%) |
11.86 |
11.84 - 12.08 |
0.7763 times |
Thu 16 October 2025 |
11.89 (-2.78%) |
12.29 |
11.80 - 12.36 |
1.3032 times |
Wed 15 October 2025 |
12.23 (-1.45%) |
12.50 |
12.21 - 12.61 |
1.2081 times |
Tue 14 October 2025 |
12.41 (1.55%) |
12.09 |
12.09 - 12.44 |
0.9083 times |
Mon 13 October 2025 |
12.22 (-0.57%) |
12.10 |
12.09 - 12.35 |
0.885 times |
Tue 07 October 2025 |
12.29 (-3%) |
12.62 |
12.18 - 12.68 |
2.0757 times |
Mon 06 October 2025 |
12.67 (-1.4%) |
12.83 |
12.67 - 13.00 |
0.9005 times |
Fri 03 October 2025 |
12.85 (-1.91%) |
13.12 |
12.85 - 13.25 |
0.5845 times |
Thu 02 October 2025 |
13.10 (1.08%) |
12.78 |
12.78 - 13.28 |
0.731 times |
Wed 01 October 2025 |
12.96 (-0.77%) |
13.06 |
12.74 - 13.06 |
1.4148 times |
Weekly price and charts StellusCapital Strong weekly Stock price targets for StellusCapital SCM are 12.04 and 12.25 | Weekly Target 1 | 11.87 | | Weekly Target 2 | 11.99 | | Weekly Target 3 | 12.076666666667 | | Weekly Target 4 | 12.2 | | Weekly Target 5 | 12.29 |
Weekly price and volumes for Stellus Capital
| Date |
Closing |
Open |
Range |
Volume |
Mon 20 October 2025 |
12.12 (1%) |
12.01 |
11.95 - 12.16 |
0.1721 times |
Fri 17 October 2025 |
12.00 (-2.36%) |
12.10 |
11.80 - 12.61 |
1.3942 times |
Tue 07 October 2025 |
12.29 (-4.36%) |
12.83 |
12.18 - 13.00 |
0.8166 times |
Fri 03 October 2025 |
12.85 (-3.53%) |
13.46 |
12.74 - 13.53 |
1.3887 times |
Fri 26 September 2025 |
13.32 (-4.86%) |
13.99 |
13.25 - 14.04 |
1.5807 times |
Fri 19 September 2025 |
14.00 (-1.13%) |
14.20 |
13.91 - 14.24 |
1.5825 times |
Fri 12 September 2025 |
14.16 (-4.32%) |
14.89 |
14.10 - 15.04 |
1.3147 times |
Fri 05 September 2025 |
14.80 (1.86%) |
14.47 |
14.35 - 14.85 |
0.7092 times |
Fri 29 August 2025 |
14.53 (0%) |
14.49 |
14.44 - 14.56 |
0.1444 times |
Fri 29 August 2025 |
14.53 (0.14%) |
14.58 |
14.42 - 14.77 |
0.8968 times |
Fri 22 August 2025 |
14.51 (-0.82%) |
14.60 |
14.35 - 14.73 |
1.0757 times |

Monthly price and charts StellusCapital Strong monthly Stock price targets for StellusCapital SCM are 11.22 and 12.7 | Monthly Target 1 | 10.92 | | Monthly Target 2 | 11.52 | | Monthly Target 3 | 12.4 | | Monthly Target 4 | 13 | | Monthly Target 5 | 13.88 |
Monthly price and volumes Stellus Capital
| Date |
Closing |
Open |
Range |
Volume |
Mon 20 October 2025 |
12.12 (-7.2%) |
13.06 |
11.80 - 13.28 |
0.7009 times |
Tue 30 September 2025 |
13.06 (-10.12%) |
14.47 |
12.92 - 15.04 |
1.3039 times |
Fri 29 August 2025 |
14.53 (3.79%) |
13.86 |
13.74 - 14.84 |
0.9458 times |
Thu 31 July 2025 |
14.00 (0.43%) |
13.92 |
13.91 - 15.39 |
1.1148 times |
Mon 30 June 2025 |
13.94 (5.05%) |
13.25 |
12.85 - 14.09 |
0.641 times |
Fri 30 May 2025 |
13.27 (3.83%) |
12.81 |
12.39 - 13.71 |
0.7695 times |
Wed 30 April 2025 |
12.78 (-8.71%) |
13.96 |
11.19 - 14.15 |
1.3288 times |
Mon 31 March 2025 |
14.00 (-8.32%) |
15.35 |
13.61 - 15.56 |
1.5201 times |
Fri 28 February 2025 |
15.27 (3.88%) |
14.53 |
14.41 - 15.55 |
0.7969 times |
Fri 31 January 2025 |
14.70 (6.83%) |
13.75 |
13.50 - 15.05 |
0.8784 times |
Tue 31 December 2024 |
13.76 (-0.43%) |
13.89 |
13.12 - 13.95 |
0.7599 times |

DMA SMA EMA moving averages of Stellus Capital SCM
DMA (daily moving average) of Stellus Capital SCM
| DMA period | DMA value | | 5 day DMA | 12.13 | | 12 day DMA | 12.48 | | 20 day DMA | 12.94 | | 35 day DMA | 13.59 | | 50 day DMA | 13.88 | | 100 day DMA | 13.98 | | 150 day DMA | 13.72 | | 200 day DMA | 13.92 | EMA (exponential moving average) of Stellus Capital SCM
| EMA period | EMA current | EMA prev | EMA prev2 | | 5 day EMA | 12.15 | 12.16 | 12.24 | | 12 day EMA | 12.48 | 12.54 | 12.64 | | 20 day EMA | 12.83 | 12.91 | 13.01 | | 35 day EMA | 13.27 | 13.34 | 13.42 | | 50 day EMA | 13.72 | 13.79 | 13.86 |
SMA (simple moving average) of Stellus Capital SCM
| SMA period | SMA current | SMA prev | SMA prev2 | | 5 day SMA | 12.13 | 12.15 | 12.21 | | 12 day SMA | 12.48 | 12.56 | 12.67 | | 20 day SMA | 12.94 | 13.03 | 13.13 | | 35 day SMA | 13.59 | 13.66 | 13.73 | | 50 day SMA | 13.88 | 13.92 | 13.96 | | 100 day SMA | 13.98 | 13.99 | 14.01 | | 150 day SMA | 13.72 | 13.73 | 13.74 | | 200 day SMA | 13.92 | 13.93 | 13.94 |
|
|
