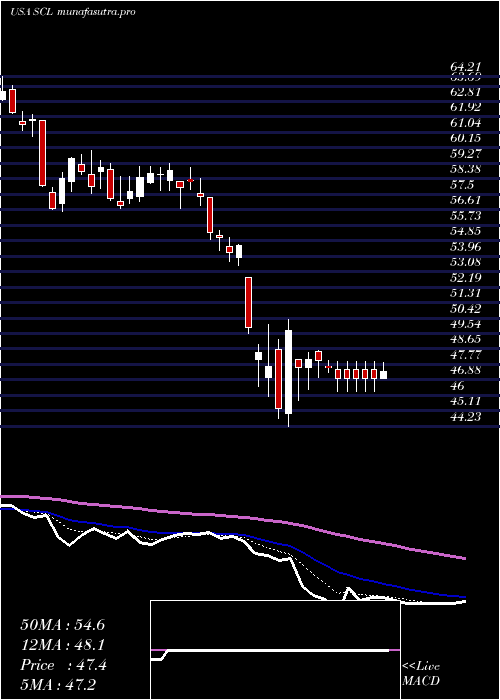
StepanCompany SCL full analysis,charts,indicators,moving averages,SMA,DMA,EMA,ADX,MACD,RSIStepan Company SCL WideScreen charts, DMA,SMA,EMA technical analysis, forecast prediction, by indicators ADX,MACD,RSI,CCI USA stock exchange
operates under Basic Industries sector & deals in Package Goods Cosmetics
Daily price and charts and targets StepanCompany Strong Daily Stock price targets for StepanCompany SCL are 44.44 and 45.5 | Daily Target 1 | 44.24 | | Daily Target 2 | 44.63 | | Daily Target 3 | 45.303333333333 | | Daily Target 4 | 45.69 | | Daily Target 5 | 46.36 |
Daily price and volume Stepan Company
| Date |
Closing |
Open |
Range |
Volume |
Thu 04 December 2025 |
45.01 (-1.94%) |
45.50 |
44.92 - 45.98 |
0.9736 times |
Wed 03 December 2025 |
45.90 (1.01%) |
45.87 |
45.50 - 46.41 |
1.0063 times |
Tue 02 December 2025 |
45.44 (0.58%) |
45.40 |
44.42 - 45.88 |
0.7068 times |
Mon 01 December 2025 |
45.18 (-0.33%) |
45.11 |
44.83 - 45.83 |
1.0615 times |
Fri 28 November 2025 |
45.33 (-0.18%) |
45.31 |
44.96 - 45.69 |
0.3716 times |
Wed 26 November 2025 |
45.41 (-0.07%) |
45.13 |
45.13 - 46.19 |
1.7313 times |
Tue 25 November 2025 |
45.44 (3.37%) |
44.37 |
44.37 - 45.92 |
1.0345 times |
Mon 24 November 2025 |
43.96 (-0.39%) |
43.78 |
43.00 - 44.02 |
1.2718 times |
Fri 21 November 2025 |
44.13 (3.47%) |
43.06 |
42.60 - 44.63 |
1.0126 times |
Thu 20 November 2025 |
42.65 (0.64%) |
42.58 |
42.36 - 43.16 |
0.8299 times |
Wed 19 November 2025 |
42.38 (-1.28%) |
42.72 |
42.28 - 43.03 |
1.0716 times |
Weekly price and charts StepanCompany Strong weekly Stock price targets for StepanCompany SCL are 43.72 and 45.71 | Weekly Target 1 | 43.29 | | Weekly Target 2 | 44.15 | | Weekly Target 3 | 45.28 | | Weekly Target 4 | 46.14 | | Weekly Target 5 | 47.27 |
Weekly price and volumes for Stepan Company
| Date |
Closing |
Open |
Range |
Volume |
Thu 04 December 2025 |
45.01 (-0.71%) |
45.11 |
44.42 - 46.41 |
0.7955 times |
Fri 28 November 2025 |
45.33 (2.72%) |
43.78 |
43.00 - 46.19 |
0.9357 times |
Fri 21 November 2025 |
44.13 (-0.09%) |
44.18 |
42.14 - 44.63 |
1.0738 times |
Fri 14 November 2025 |
44.17 (1.96%) |
43.78 |
43.13 - 45.35 |
1.0897 times |
Fri 07 November 2025 |
43.32 (-0.07%) |
42.25 |
41.82 - 44.25 |
1.0627 times |
Fri 31 October 2025 |
43.35 (0%) |
42.70 |
42.00 - 43.70 |
0.4479 times |
Fri 31 October 2025 |
43.35 (-6.05%) |
46.08 |
42.00 - 46.40 |
1.8895 times |
Fri 24 October 2025 |
46.14 (1.14%) |
45.83 |
45.26 - 46.68 |
1.1984 times |
Fri 17 October 2025 |
45.62 (-3.35%) |
47.62 |
45.60 - 48.32 |
0.9255 times |
Fri 10 October 2025 |
47.20 (-3.93%) |
49.23 |
47.10 - 49.67 |
0.5814 times |
Fri 03 October 2025 |
49.13 (4.02%) |
47.30 |
46.40 - 50.09 |
0.8079 times |

Monthly price and charts StepanCompany Strong monthly Stock price targets for StepanCompany SCL are 43.72 and 45.71 | Monthly Target 1 | 43.29 | | Monthly Target 2 | 44.15 | | Monthly Target 3 | 45.28 | | Monthly Target 4 | 46.14 | | Monthly Target 5 | 47.27 |
Monthly price and volumes Stepan Company
| Date |
Closing |
Open |
Range |
Volume |
Thu 04 December 2025 |
45.01 (-0.71%) |
45.11 |
44.42 - 46.41 |
0.2162 times |
Fri 28 November 2025 |
45.33 (4.57%) |
42.25 |
41.82 - 46.19 |
1.1311 times |
Fri 31 October 2025 |
43.35 (-9.12%) |
47.50 |
42.00 - 50.09 |
1.4909 times |
Tue 30 September 2025 |
47.70 (-4.66%) |
49.38 |
46.40 - 50.89 |
1.2258 times |
Fri 29 August 2025 |
50.03 (-1.46%) |
50.16 |
47.97 - 52.30 |
1.3597 times |
Thu 31 July 2025 |
50.77 (-6.98%) |
54.28 |
47.94 - 60.85 |
0.8114 times |
Mon 30 June 2025 |
54.58 (0.53%) |
54.01 |
52.87 - 57.49 |
0.6756 times |
Fri 30 May 2025 |
54.29 (7.38%) |
50.60 |
50.00 - 58.24 |
1.0924 times |
Wed 30 April 2025 |
50.56 (-8.14%) |
54.51 |
44.23 - 55.03 |
1.0287 times |
Mon 31 March 2025 |
55.04 (-10.88%) |
61.72 |
54.31 - 61.72 |
0.9683 times |
Fri 28 February 2025 |
61.76 (-2.57%) |
62.40 |
59.55 - 64.67 |
0.8037 times |

DMA SMA EMA moving averages of Stepan Company SCL
DMA (daily moving average) of Stepan Company SCL
| DMA period | DMA value | | 5 day DMA | 45.37 | | 12 day DMA | 44.48 | | 20 day DMA | 44.17 | | 35 day DMA | 44.41 | | 50 day DMA | 45.41 | | 100 day DMA | 48.17 | | 150 day DMA | 50.63 | | 200 day DMA | 51.49 | EMA (exponential moving average) of Stepan Company SCL
| EMA period | EMA current | EMA prev | EMA prev2 | | 5 day EMA | 45.25 | 45.37 | 45.11 | | 12 day EMA | 44.82 | 44.79 | 44.59 | | 20 day EMA | 44.66 | 44.62 | 44.48 | | 35 day EMA | 45.09 | 45.09 | 45.04 | | 50 day EMA | 45.64 | 45.67 | 45.66 |
SMA (simple moving average) of Stepan Company SCL
| SMA period | SMA current | SMA prev | SMA prev2 | | 5 day SMA | 45.37 | 45.45 | 45.36 | | 12 day SMA | 44.48 | 44.29 | 44.14 | | 20 day SMA | 44.17 | 44.12 | 43.94 | | 35 day SMA | 44.41 | 44.47 | 44.5 | | 50 day SMA | 45.41 | 45.46 | 45.49 | | 100 day SMA | 48.17 | 48.29 | 48.41 | | 150 day SMA | 50.63 | 50.67 | 50.71 | | 200 day SMA | 51.49 | 51.58 | 51.66 |
|
|
