CompanhiaDe SBS full analysis,charts,indicators,moving averages,SMA,DMA,EMA,ADX,MACD,RSICompanhia De SBS WideScreen charts, DMA,SMA,EMA technical analysis, forecast prediction, by indicators ADX,MACD,RSI,CCI USA stock exchange
operates under Public Utilities sector & deals in Water Supply
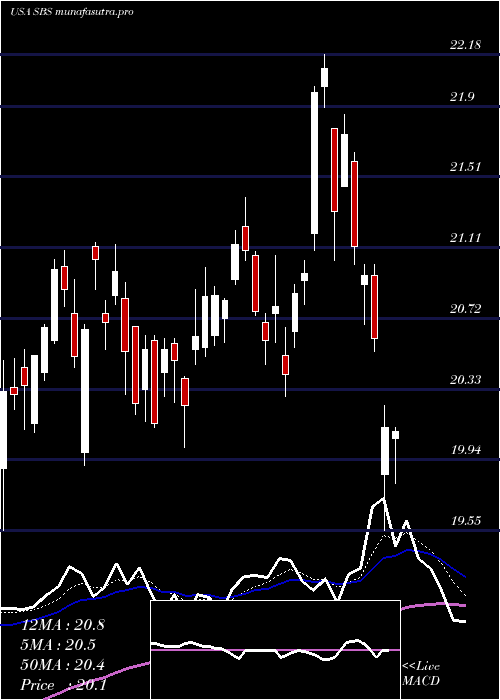
Daily price and charts and targets CompanhiaDe Strong Daily Stock price targets for CompanhiaDe SBS are 26.64 and 26.97 | Daily Target 1 | 26.55 | | Daily Target 2 | 26.72 | | Daily Target 3 | 26.883333333333 | | Daily Target 4 | 27.05 | | Daily Target 5 | 27.21 |
Daily price and volume Companhia De
| Date |
Closing |
Open |
Range |
Volume |
Thu 04 December 2025 |
26.88 (0.71%) |
26.98 |
26.72 - 27.05 |
1.0433 times |
Wed 03 December 2025 |
26.69 (-0.96%) |
26.91 |
26.53 - 26.91 |
1.109 times |
Tue 02 December 2025 |
26.95 (3.49%) |
26.69 |
26.62 - 27.08 |
1.552 times |
Mon 01 December 2025 |
26.04 (-1.25%) |
26.23 |
25.96 - 26.39 |
0.8109 times |
Fri 28 November 2025 |
26.37 (-0.3%) |
26.43 |
26.16 - 26.43 |
0.3799 times |
Wed 26 November 2025 |
26.45 (1.97%) |
26.50 |
26.25 - 26.57 |
0.6041 times |
Tue 25 November 2025 |
25.94 (-0.38%) |
25.98 |
25.77 - 26.13 |
1.0888 times |
Mon 24 November 2025 |
26.04 (2.52%) |
25.62 |
25.53 - 26.04 |
1.2514 times |
Fri 21 November 2025 |
25.40 (0.99%) |
25.30 |
25.06 - 25.46 |
0.9377 times |
Thu 20 November 2025 |
25.15 (-2.18%) |
25.85 |
25.14 - 26.10 |
1.2228 times |
Wed 19 November 2025 |
25.71 (0.86%) |
25.72 |
25.43 - 25.84 |
1.1775 times |
Weekly price and charts CompanhiaDe Strong weekly Stock price targets for CompanhiaDe SBS are 26.42 and 27.54 | Weekly Target 1 | 25.52 | | Weekly Target 2 | 26.2 | | Weekly Target 3 | 26.64 | | Weekly Target 4 | 27.32 | | Weekly Target 5 | 27.76 |
Weekly price and volumes for Companhia De
| Date |
Closing |
Open |
Range |
Volume |
Thu 04 December 2025 |
26.88 (1.93%) |
26.23 |
25.96 - 27.08 |
1.0388 times |
Fri 28 November 2025 |
26.37 (3.82%) |
25.62 |
25.53 - 26.57 |
0.7648 times |
Fri 21 November 2025 |
25.40 (-5.33%) |
26.65 |
25.06 - 26.75 |
1.3515 times |
Fri 14 November 2025 |
26.83 (4.44%) |
25.97 |
25.63 - 27.12 |
1.9527 times |
Fri 07 November 2025 |
25.69 (4.69%) |
24.76 |
24.72 - 25.88 |
0.8757 times |
Fri 31 October 2025 |
24.54 (0%) |
24.58 |
24.28 - 24.63 |
0.207 times |
Fri 31 October 2025 |
24.54 (-0.73%) |
25.00 |
24.28 - 25.07 |
1.0089 times |
Fri 24 October 2025 |
24.72 (3.6%) |
24.24 |
23.99 - 24.85 |
1.3677 times |
Fri 17 October 2025 |
23.86 (2.32%) |
22.65 |
22.42 - 24.01 |
1.0442 times |
Tue 07 October 2025 |
23.32 (-2.79%) |
23.97 |
23.20 - 24.15 |
0.3888 times |
Fri 03 October 2025 |
23.99 (-0.17%) |
24.37 |
23.70 - 25.07 |
1.289 times |
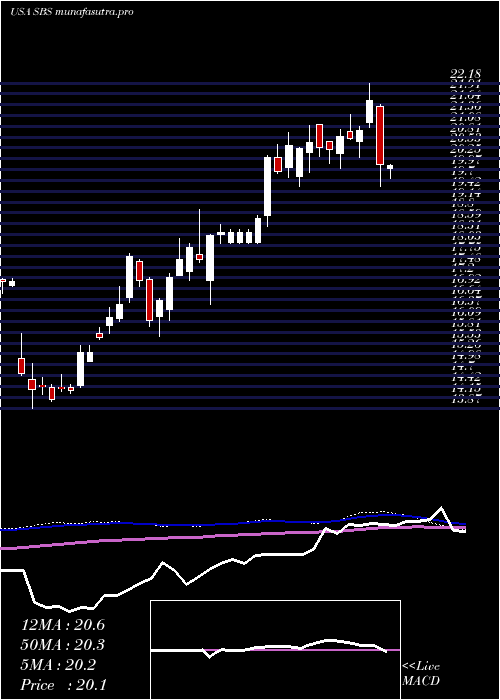
Monthly price and charts CompanhiaDe Strong monthly Stock price targets for CompanhiaDe SBS are 26.42 and 27.54 | Monthly Target 1 | 25.52 | | Monthly Target 2 | 26.2 | | Monthly Target 3 | 26.64 | | Monthly Target 4 | 27.32 | | Monthly Target 5 | 27.76 |
Monthly price and volumes Companhia De
| Date |
Closing |
Open |
Range |
Volume |
Thu 04 December 2025 |
26.88 (1.93%) |
26.23 |
25.96 - 27.08 |
0.1926 times |
Fri 28 November 2025 |
26.37 (7.46%) |
24.76 |
24.72 - 27.12 |
0.9166 times |
Fri 31 October 2025 |
24.54 (-1.41%) |
25.00 |
22.42 - 25.07 |
0.8749 times |
Tue 30 September 2025 |
24.89 (9.89%) |
21.90 |
21.88 - 25.00 |
1.2092 times |
Fri 29 August 2025 |
22.65 (17.48%) |
19.89 |
19.45 - 22.88 |
1.19 times |
Thu 31 July 2025 |
19.28 (-12.24%) |
22.00 |
18.88 - 22.18 |
1.2452 times |
Mon 30 June 2025 |
21.97 (6.96%) |
20.68 |
20.01 - 22.00 |
0.8277 times |
Fri 30 May 2025 |
20.54 (1.03%) |
20.62 |
19.55 - 21.14 |
1.2697 times |
Wed 30 April 2025 |
20.33 (13.83%) |
17.73 |
16.53 - 20.46 |
1.3791 times |
Mon 31 March 2025 |
17.86 (10.86%) |
16.21 |
15.70 - 18.22 |
0.8951 times |
Fri 28 February 2025 |
16.11 (-0.43%) |
16.16 |
15.96 - 17.82 |
0.8319 times |

DMA SMA EMA moving averages of Companhia De SBS
DMA (daily moving average) of Companhia De SBS
| DMA period | DMA value | | 5 day DMA | 26.59 | | 12 day DMA | 26.09 | | 20 day DMA | 26.11 | | 35 day DMA | 25.39 | | 50 day DMA | 24.97 | | 100 day DMA | 23.21 | | 150 day DMA | 22.36 | | 200 day DMA | 21.16 | EMA (exponential moving average) of Companhia De SBS
| EMA period | EMA current | EMA prev | EMA prev2 | | 5 day EMA | 26.62 | 26.49 | 26.39 | | 12 day EMA | 26.3 | 26.19 | 26.1 | | 20 day EMA | 26.02 | 25.93 | 25.85 | | 35 day EMA | 25.55 | 25.47 | 25.4 | | 50 day EMA | 25.06 | 24.99 | 24.92 |
SMA (simple moving average) of Companhia De SBS
| SMA period | SMA current | SMA prev | SMA prev2 | | 5 day SMA | 26.59 | 26.5 | 26.35 | | 12 day SMA | 26.09 | 26.03 | 26.04 | | 20 day SMA | 26.11 | 26.05 | 25.95 | | 35 day SMA | 25.39 | 25.29 | 25.18 | | 50 day SMA | 24.97 | 24.93 | 24.88 | | 100 day SMA | 23.21 | 23.14 | 23.08 | | 150 day SMA | 22.36 | 22.31 | 22.27 | | 200 day SMA | 21.16 | 21.11 | 21.06 |
|
|
