SabraHealth SBRA full analysis,charts,indicators,moving averages,SMA,DMA,EMA,ADX,MACD,RSISabra Health SBRA WideScreen charts, DMA,SMA,EMA technical analysis, forecast prediction, by indicators ADX,MACD,RSI,CCI USA stock exchange
operates under Consumer Services sector & deals in Real Estate Investment Trusts
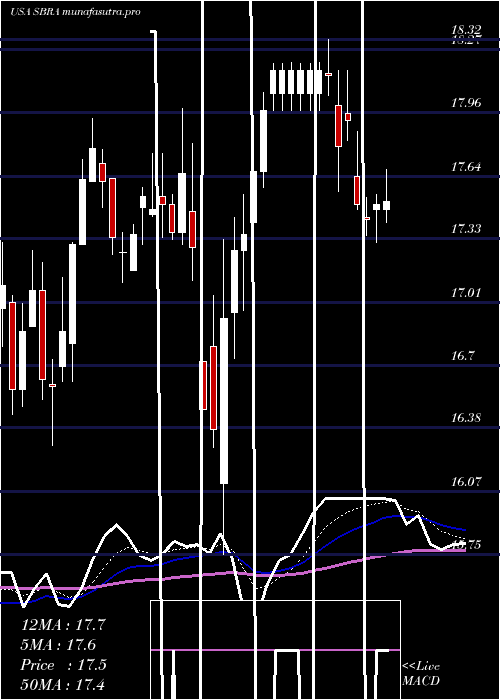
Daily price and charts and targets SabraHealth Strong Daily Stock price targets for SabraHealth SBRA are 18.89 and 19.17 | Daily Target 1 | 18.84 | | Daily Target 2 | 18.94 | | Daily Target 3 | 19.116666666667 | | Daily Target 4 | 19.22 | | Daily Target 5 | 19.4 |
Daily price and volume Sabra Health
| Date |
Closing |
Open |
Range |
Volume |
Thu 04 December 2025 |
19.05 (-0.88%) |
19.09 |
19.01 - 19.29 |
1.4126 times |
Wed 03 December 2025 |
19.22 (-0.98%) |
19.34 |
19.09 - 19.42 |
1.0454 times |
Tue 02 December 2025 |
19.41 (0.67%) |
19.30 |
19.06 - 19.43 |
1.0027 times |
Mon 01 December 2025 |
19.28 (-1.18%) |
19.41 |
19.21 - 19.60 |
1.0695 times |
Fri 28 November 2025 |
19.51 (0.88%) |
19.38 |
19.28 - 19.52 |
0.5968 times |
Wed 26 November 2025 |
19.34 (2.11%) |
18.96 |
18.95 - 19.41 |
1.0025 times |
Tue 25 November 2025 |
18.94 (1.72%) |
18.75 |
18.70 - 19.11 |
0.9415 times |
Mon 24 November 2025 |
18.62 (-0.59%) |
18.66 |
18.60 - 18.89 |
0.8213 times |
Fri 21 November 2025 |
18.73 (0.97%) |
18.55 |
18.33 - 18.88 |
1.0211 times |
Thu 20 November 2025 |
18.55 (-0.32%) |
18.72 |
18.53 - 18.90 |
1.0867 times |
Wed 19 November 2025 |
18.61 (-1.06%) |
18.81 |
18.53 - 18.89 |
0.6783 times |
Weekly price and charts SabraHealth Strong weekly Stock price targets for SabraHealth SBRA are 18.74 and 19.33 | Weekly Target 1 | 18.63 | | Weekly Target 2 | 18.84 | | Weekly Target 3 | 19.22 | | Weekly Target 4 | 19.43 | | Weekly Target 5 | 19.81 |
Weekly price and volumes for Sabra Health
| Date |
Closing |
Open |
Range |
Volume |
Thu 04 December 2025 |
19.05 (-2.36%) |
19.41 |
19.01 - 19.60 |
0.9439 times |
Fri 28 November 2025 |
19.51 (4.16%) |
18.66 |
18.60 - 19.52 |
0.7005 times |
Fri 21 November 2025 |
18.73 (0.43%) |
18.46 |
18.30 - 18.90 |
1.1239 times |
Fri 14 November 2025 |
18.65 (-1.22%) |
18.88 |
18.54 - 19.24 |
1.1525 times |
Fri 07 November 2025 |
18.88 (5.95%) |
18.39 |
17.69 - 19.22 |
1.3801 times |
Fri 31 October 2025 |
17.82 (0%) |
17.31 |
17.27 - 18.02 |
0.2584 times |
Fri 31 October 2025 |
17.82 (-1.44%) |
18.21 |
17.17 - 18.70 |
0.9595 times |
Fri 24 October 2025 |
18.08 (-0.28%) |
18.15 |
18.03 - 18.44 |
0.6122 times |
Fri 17 October 2025 |
18.13 (2.2%) |
17.65 |
17.47 - 18.25 |
1.1623 times |
Fri 10 October 2025 |
17.74 (-2.21%) |
18.14 |
17.70 - 18.24 |
1.7066 times |
Fri 03 October 2025 |
18.14 (-3.66%) |
18.81 |
17.94 - 18.83 |
1.0234 times |
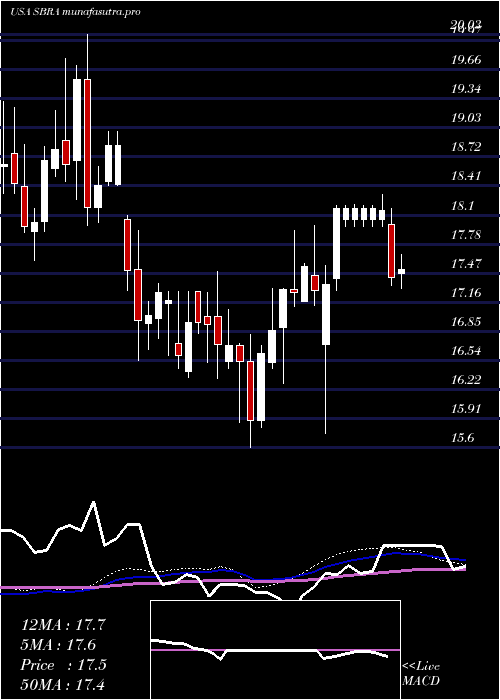
Monthly price and charts SabraHealth Strong monthly Stock price targets for SabraHealth SBRA are 18.74 and 19.33 | Monthly Target 1 | 18.63 | | Monthly Target 2 | 18.84 | | Monthly Target 3 | 19.22 | | Monthly Target 4 | 19.43 | | Monthly Target 5 | 19.81 |
Monthly price and volumes Sabra Health
| Date |
Closing |
Open |
Range |
Volume |
Thu 04 December 2025 |
19.05 (-2.36%) |
19.41 |
19.01 - 19.60 |
0.2542 times |
Fri 28 November 2025 |
19.51 (9.48%) |
18.39 |
17.69 - 19.52 |
1.1733 times |
Fri 31 October 2025 |
17.82 (-4.4%) |
18.51 |
17.17 - 18.71 |
1.4482 times |
Tue 30 September 2025 |
18.64 (-2.46%) |
19.02 |
18.45 - 19.32 |
0.8824 times |
Fri 29 August 2025 |
19.11 (5.99%) |
18.34 |
18.02 - 19.97 |
1.1501 times |
Thu 31 July 2025 |
18.03 (-2.22%) |
18.46 |
17.80 - 18.99 |
1.0022 times |
Mon 30 June 2025 |
18.44 (5.49%) |
17.35 |
17.13 - 18.69 |
1.0115 times |
Fri 30 May 2025 |
17.48 (-2.07%) |
17.80 |
17.04 - 18.38 |
1.1524 times |
Wed 30 April 2025 |
17.85 (2.18%) |
17.54 |
15.75 - 18.32 |
0.9903 times |
Mon 31 March 2025 |
17.47 (5.18%) |
16.51 |
16.29 - 17.93 |
0.9353 times |
Fri 28 February 2025 |
16.61 (-0.6%) |
16.52 |
15.60 - 17.08 |
0.9629 times |

DMA SMA EMA moving averages of Sabra Health SBRA
DMA (daily moving average) of Sabra Health SBRA
| DMA period | DMA value | | 5 day DMA | 19.29 | | 12 day DMA | 19.01 | | 20 day DMA | 18.94 | | 35 day DMA | 18.53 | | 50 day DMA | 18.4 | | 100 day DMA | 18.57 | | 150 day DMA | 18.38 | | 200 day DMA | 18.1 | EMA (exponential moving average) of Sabra Health SBRA
| EMA period | EMA current | EMA prev | EMA prev2 | | 5 day EMA | 19.18 | 19.25 | 19.26 | | 12 day EMA | 19.04 | 19.04 | 19.01 | | 20 day EMA | 18.89 | 18.87 | 18.83 | | 35 day EMA | 18.73 | 18.71 | 18.68 | | 50 day EMA | 18.51 | 18.49 | 18.46 |
SMA (simple moving average) of Sabra Health SBRA
| SMA period | SMA current | SMA prev | SMA prev2 | | 5 day SMA | 19.29 | 19.35 | 19.3 | | 12 day SMA | 19.01 | 18.97 | 18.92 | | 20 day SMA | 18.94 | 18.9 | 18.84 | | 35 day SMA | 18.53 | 18.49 | 18.44 | | 50 day SMA | 18.4 | 18.4 | 18.39 | | 100 day SMA | 18.57 | 18.56 | 18.56 | | 150 day SMA | 18.38 | 18.37 | 18.36 | | 200 day SMA | 18.1 | 18.09 | 18.07 |
|
|
