WesternAsset SBI full analysis,charts,indicators,moving averages,SMA,DMA,EMA,ADX,MACD,RSIWestern Asset SBI WideScreen charts, DMA,SMA,EMA technical analysis, forecast prediction, by indicators ADX,MACD,RSI,CCI USA stock exchange
operates under N A sector & deals in N A
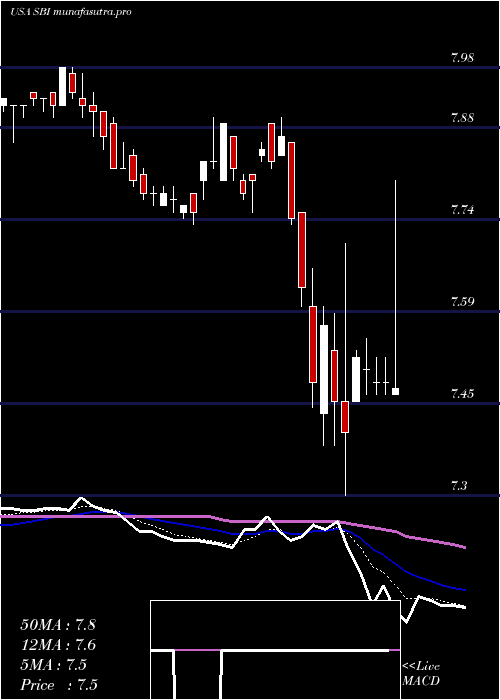
Daily price and charts and targets WesternAsset Strong Daily Stock price targets for WesternAsset SBI are 7.78 and 7.84 | Daily Target 1 | 7.73 | | Daily Target 2 | 7.77 | | Daily Target 3 | 7.7933333333333 | | Daily Target 4 | 7.83 | | Daily Target 5 | 7.85 |
Daily price and volume Western Asset
| Date |
Closing |
Open |
Range |
Volume |
Thu 04 December 2025 |
7.80 (0.13%) |
7.76 |
7.76 - 7.82 |
0.6082 times |
Wed 03 December 2025 |
7.79 (0.26%) |
7.75 |
7.73 - 7.81 |
0.8633 times |
Tue 02 December 2025 |
7.77 (0.52%) |
7.70 |
7.70 - 7.78 |
1.404 times |
Mon 01 December 2025 |
7.73 (-0.26%) |
7.71 |
7.70 - 7.81 |
1.1903 times |
Fri 28 November 2025 |
7.75 (0.39%) |
7.72 |
7.72 - 7.76 |
0.5472 times |
Wed 26 November 2025 |
7.72 (0.13%) |
7.69 |
7.69 - 7.74 |
0.5428 times |
Tue 25 November 2025 |
7.71 (-0.13%) |
7.72 |
7.71 - 7.75 |
1.4018 times |
Mon 24 November 2025 |
7.72 (0.26%) |
7.69 |
7.69 - 7.72 |
1.1467 times |
Fri 21 November 2025 |
7.70 (-0.26%) |
7.72 |
7.67 - 7.75 |
1.199 times |
Thu 20 November 2025 |
7.72 (-0.9%) |
7.77 |
7.71 - 7.77 |
1.0966 times |
Wed 19 November 2025 |
7.79 (-0.26%) |
7.79 |
7.79 - 7.85 |
0.6715 times |
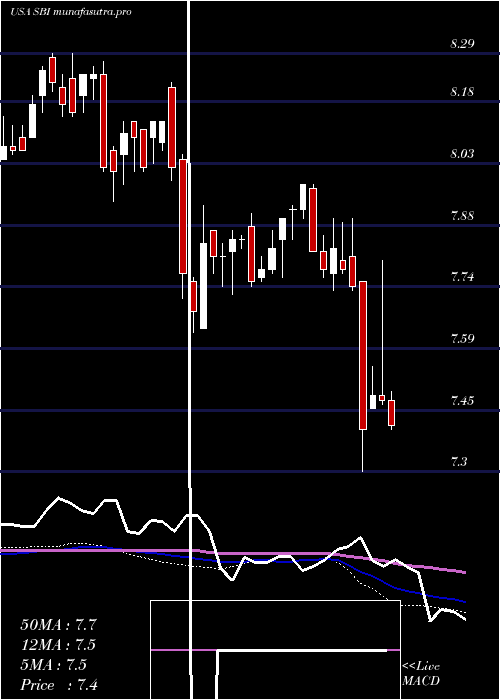
Weekly price and charts WesternAsset Strong weekly Stock price targets for WesternAsset SBI are 7.75 and 7.87 | Weekly Target 1 | 7.65 | | Weekly Target 2 | 7.73 | | Weekly Target 3 | 7.7733333333333 | | Weekly Target 4 | 7.85 | | Weekly Target 5 | 7.89 |
Weekly price and volumes for Western Asset
| Date |
Closing |
Open |
Range |
Volume |
Thu 04 December 2025 |
7.80 (0.65%) |
7.71 |
7.70 - 7.82 |
1.0669 times |
Fri 28 November 2025 |
7.75 (0.65%) |
7.69 |
7.69 - 7.76 |
0.9547 times |
Fri 21 November 2025 |
7.70 (-1.91%) |
7.87 |
7.67 - 7.87 |
1.1824 times |
Fri 14 November 2025 |
7.85 (0.26%) |
7.85 |
7.82 - 7.91 |
0.937 times |
Fri 07 November 2025 |
7.83 (-0.51%) |
7.86 |
7.80 - 7.90 |
0.4205 times |
Fri 31 October 2025 |
7.87 (0%) |
7.85 |
7.83 - 7.88 |
0.3038 times |
Fri 31 October 2025 |
7.87 (0.25%) |
7.89 |
7.79 - 7.89 |
1.2671 times |
Fri 24 October 2025 |
7.85 (0%) |
7.87 |
7.82 - 7.95 |
1.282 times |
Fri 17 October 2025 |
7.85 (-1.51%) |
7.95 |
7.79 - 7.99 |
1.9307 times |
Tue 07 October 2025 |
7.97 (0.76%) |
7.86 |
7.86 - 7.99 |
0.655 times |
Fri 03 October 2025 |
7.91 (0.51%) |
7.86 |
7.86 - 7.99 |
1.0312 times |
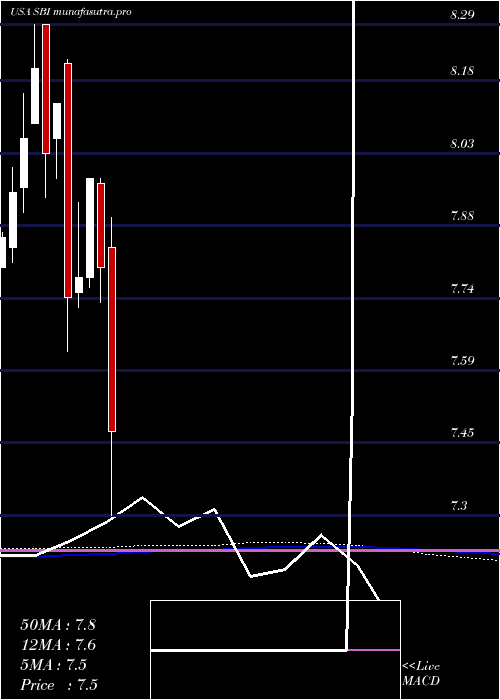
Monthly price and charts WesternAsset Strong monthly Stock price targets for WesternAsset SBI are 7.75 and 7.87 | Monthly Target 1 | 7.65 | | Monthly Target 2 | 7.73 | | Monthly Target 3 | 7.7733333333333 | | Monthly Target 4 | 7.85 | | Monthly Target 5 | 7.89 |
Monthly price and volumes Western Asset
| Date |
Closing |
Open |
Range |
Volume |
Thu 04 December 2025 |
7.80 (0.65%) |
7.71 |
7.70 - 7.82 |
0.1975 times |
Fri 28 November 2025 |
7.75 (-1.52%) |
7.86 |
7.67 - 7.91 |
0.6471 times |
Fri 31 October 2025 |
7.87 (-0.51%) |
7.93 |
7.79 - 7.99 |
1.1334 times |
Tue 30 September 2025 |
7.91 (3.53%) |
7.65 |
7.62 - 7.95 |
1.0011 times |
Fri 29 August 2025 |
7.64 (1.06%) |
7.60 |
7.51 - 7.70 |
0.9793 times |
Thu 31 July 2025 |
7.56 (0.53%) |
7.55 |
7.52 - 7.71 |
0.9032 times |
Mon 30 June 2025 |
7.52 (1.08%) |
7.47 |
7.40 - 7.53 |
1.5412 times |
Fri 30 May 2025 |
7.44 (-1.2%) |
7.58 |
7.43 - 7.75 |
1.5154 times |
Wed 30 April 2025 |
7.53 (-3.46%) |
7.84 |
7.30 - 7.90 |
1.2553 times |
Mon 31 March 2025 |
7.80 (-2.26%) |
7.97 |
7.73 - 7.98 |
0.8266 times |
Fri 28 February 2025 |
7.98 (2.57%) |
7.78 |
7.76 - 7.98 |
1.2676 times |
DMA SMA EMA moving averages of Western Asset SBI
DMA (daily moving average) of Western Asset SBI
| DMA period | DMA value | | 5 day DMA | 7.77 | | 12 day DMA | 7.75 | | 20 day DMA | 7.79 | | 35 day DMA | 7.82 | | 50 day DMA | 7.84 | | 100 day DMA | 7.77 | | 150 day DMA | 7.68 | | 200 day DMA | 7.7 | EMA (exponential moving average) of Western Asset SBI
| EMA period | EMA current | EMA prev | EMA prev2 | | 5 day EMA | 7.77 | 7.76 | 7.75 | | 12 day EMA | 7.77 | 7.76 | 7.76 | | 20 day EMA | 7.79 | 7.79 | 7.79 | | 35 day EMA | 7.81 | 7.81 | 7.81 | | 50 day EMA | 7.85 | 7.85 | 7.85 |
SMA (simple moving average) of Western Asset SBI
| SMA period | SMA current | SMA prev | SMA prev2 | | 5 day SMA | 7.77 | 7.75 | 7.74 | | 12 day SMA | 7.75 | 7.75 | 7.76 | | 20 day SMA | 7.79 | 7.79 | 7.8 | | 35 day SMA | 7.82 | 7.82 | 7.82 | | 50 day SMA | 7.84 | 7.84 | 7.85 | | 100 day SMA | 7.77 | 7.76 | 7.76 | | 150 day SMA | 7.68 | 7.68 | 7.68 | | 200 day SMA | 7.7 | 7.7 | 7.7 |
|
|
