SeacoastBanking SBCF full analysis,charts,indicators,moving averages,SMA,DMA,EMA,ADX,MACD,RSISeacoast Banking SBCF WideScreen charts, DMA,SMA,EMA technical analysis, forecast prediction, by indicators ADX,MACD,RSI,CCI USA stock exchange
operates under Finance sector & deals in Major Banks
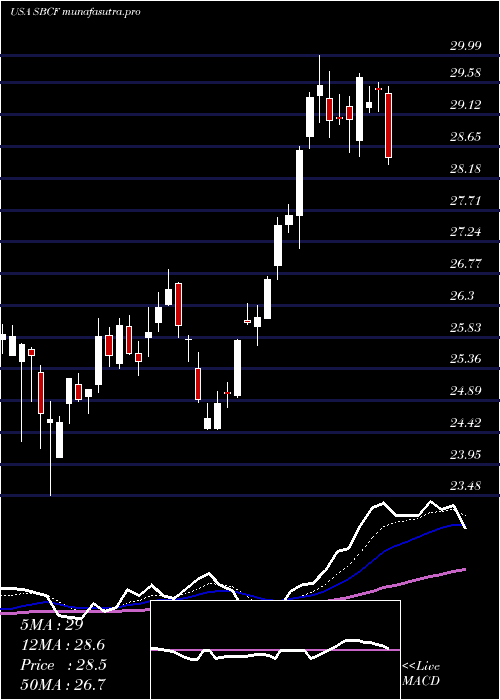
Daily price and charts and targets SeacoastBanking Strong Daily Stock price targets for SeacoastBanking SBCF are 29.74 and 30.95 | Daily Target 1 | 28.75 | | Daily Target 2 | 29.51 | | Daily Target 3 | 29.96 | | Daily Target 4 | 30.72 | | Daily Target 5 | 31.17 |
Daily price and volume Seacoast Banking
| Date |
Closing |
Open |
Range |
Volume |
Mon 20 October 2025 |
30.27 (3.84%) |
29.43 |
29.20 - 30.41 |
0.7383 times |
Fri 17 October 2025 |
29.15 (1.22%) |
28.89 |
28.62 - 29.30 |
0.9568 times |
Thu 16 October 2025 |
28.80 (-5.88%) |
30.45 |
28.58 - 30.49 |
2.2442 times |
Wed 15 October 2025 |
30.60 (-3.23%) |
31.74 |
30.44 - 31.87 |
0.9034 times |
Tue 14 October 2025 |
31.62 (3.43%) |
30.31 |
30.29 - 31.75 |
0.801 times |
Mon 13 October 2025 |
30.57 (2.21%) |
30.23 |
30.05 - 30.60 |
0.6599 times |
Fri 10 October 2025 |
29.91 (-4.44%) |
31.45 |
29.88 - 31.60 |
1.042 times |
Thu 09 October 2025 |
31.30 (-1.23%) |
31.76 |
31.10 - 31.79 |
0.7145 times |
Wed 08 October 2025 |
31.69 (-0.09%) |
31.92 |
31.50 - 31.92 |
0.925 times |
Tue 07 October 2025 |
31.72 (0.79%) |
31.51 |
31.28 - 31.96 |
1.0149 times |
Mon 06 October 2025 |
31.47 (1.78%) |
31.16 |
30.96 - 32.33 |
1.2363 times |
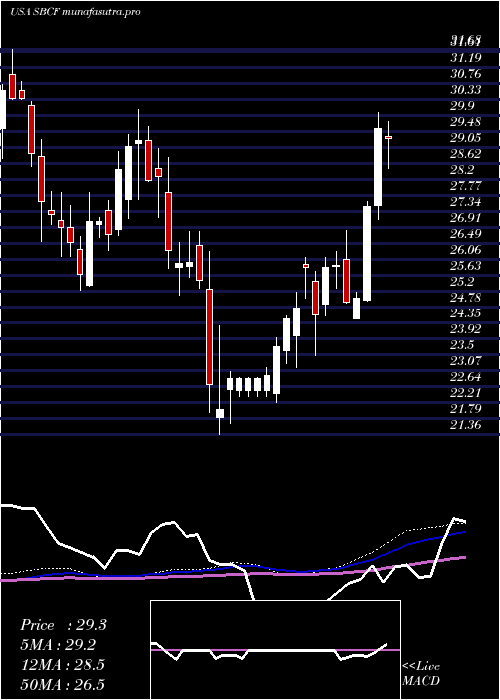
Weekly price and charts SeacoastBanking Strong weekly Stock price targets for SeacoastBanking SBCF are 29.74 and 30.95 | Weekly Target 1 | 28.75 | | Weekly Target 2 | 29.51 | | Weekly Target 3 | 29.96 | | Weekly Target 4 | 30.72 | | Weekly Target 5 | 31.17 |
Weekly price and volumes for Seacoast Banking
| Date |
Closing |
Open |
Range |
Volume |
Mon 20 October 2025 |
30.27 (3.84%) |
29.43 |
29.20 - 30.41 |
0.1896 times |
Fri 17 October 2025 |
29.15 (-2.54%) |
30.23 |
28.58 - 31.87 |
1.4289 times |
Fri 10 October 2025 |
29.91 (-3.27%) |
31.16 |
29.88 - 32.33 |
1.2665 times |
Fri 03 October 2025 |
30.92 (1.05%) |
30.55 |
29.60 - 31.29 |
1.1542 times |
Fri 26 September 2025 |
30.60 (-1.1%) |
30.79 |
29.94 - 31.19 |
0.9325 times |
Fri 19 September 2025 |
30.94 (0.19%) |
30.87 |
29.86 - 32.09 |
1.7991 times |
Fri 12 September 2025 |
30.88 (-1.5%) |
31.35 |
30.53 - 31.83 |
0.9225 times |
Fri 05 September 2025 |
31.35 (0.77%) |
30.78 |
30.44 - 32.09 |
0.9158 times |
Fri 29 August 2025 |
31.11 (0%) |
31.10 |
31.03 - 31.34 |
0.2154 times |
Fri 29 August 2025 |
31.11 (0.45%) |
30.97 |
30.74 - 31.36 |
1.1755 times |
Fri 22 August 2025 |
30.97 (7.61%) |
28.76 |
27.96 - 31.03 |
1.4285 times |
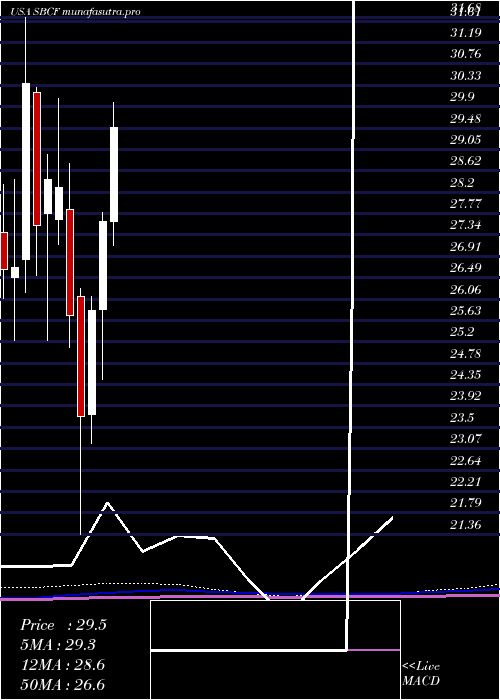
Monthly price and charts SeacoastBanking Strong monthly Stock price targets for SeacoastBanking SBCF are 29.43 and 33.18 | Monthly Target 1 | 26.64 | | Monthly Target 2 | 28.46 | | Monthly Target 3 | 30.393333333333 | | Monthly Target 4 | 32.21 | | Monthly Target 5 | 34.14 |
Monthly price and volumes Seacoast Banking
| Date |
Closing |
Open |
Range |
Volume |
Mon 20 October 2025 |
30.27 (-0.53%) |
30.21 |
28.58 - 32.33 |
0.7749 times |
Tue 30 September 2025 |
30.43 (-2.19%) |
30.78 |
29.86 - 32.09 |
1.1564 times |
Fri 29 August 2025 |
31.11 (10.36%) |
27.84 |
27.22 - 31.36 |
1.3277 times |
Thu 31 July 2025 |
28.19 (2.06%) |
27.62 |
27.13 - 29.99 |
1.3531 times |
Mon 30 June 2025 |
27.62 (6.93%) |
25.85 |
24.46 - 27.79 |
1.231 times |
Fri 30 May 2025 |
25.83 (8.94%) |
23.75 |
23.17 - 26.11 |
0.7064 times |
Wed 30 April 2025 |
23.71 (-7.85%) |
26.11 |
21.36 - 26.27 |
1.0787 times |
Mon 31 March 2025 |
25.73 (-9.02%) |
27.84 |
25.09 - 28.77 |
0.8657 times |
Fri 28 February 2025 |
28.28 (-0.6%) |
27.66 |
27.15 - 30.06 |
0.7158 times |
Fri 31 January 2025 |
28.45 (3.34%) |
27.77 |
25.23 - 28.95 |
0.7903 times |
Tue 31 December 2024 |
27.53 (-9.35%) |
30.18 |
26.52 - 30.29 |
0.6031 times |
DMA SMA EMA moving averages of Seacoast Banking SBCF
DMA (daily moving average) of Seacoast Banking SBCF
| DMA period | DMA value | | 5 day DMA | 30.09 | | 12 day DMA | 30.67 | | 20 day DMA | 30.6 | | 35 day DMA | 30.74 | | 50 day DMA | 30.52 | | 100 day DMA | 28.97 | | 150 day DMA | 27.42 | | 200 day DMA | 27.45 | EMA (exponential moving average) of Seacoast Banking SBCF
| EMA period | EMA current | EMA prev | EMA prev2 | | 5 day EMA | 29.99 | 29.85 | 30.2 | | 12 day EMA | 30.35 | 30.36 | 30.58 | | 20 day EMA | 30.49 | 30.51 | 30.65 | | 35 day EMA | 30.38 | 30.39 | 30.46 | | 50 day EMA | 30.23 | 30.23 | 30.27 |
SMA (simple moving average) of Seacoast Banking SBCF
| SMA period | SMA current | SMA prev | SMA prev2 | | 5 day SMA | 30.09 | 30.15 | 30.3 | | 12 day SMA | 30.67 | 30.68 | 30.79 | | 20 day SMA | 30.6 | 30.62 | 30.71 | | 35 day SMA | 30.74 | 30.76 | 30.82 | | 50 day SMA | 30.52 | 30.47 | 30.43 | | 100 day SMA | 28.97 | 28.92 | 28.88 | | 150 day SMA | 27.42 | 27.39 | 27.37 | | 200 day SMA | 27.45 | 27.43 | 27.42 |
|
|
