SaratogaInvestment SAR full analysis,charts,indicators,moving averages,SMA,DMA,EMA,ADX,MACD,RSISaratoga Investment SAR WideScreen charts, DMA,SMA,EMA technical analysis, forecast prediction, by indicators ADX,MACD,RSI,CCI USA stock exchange
operates under N A sector & deals in N A
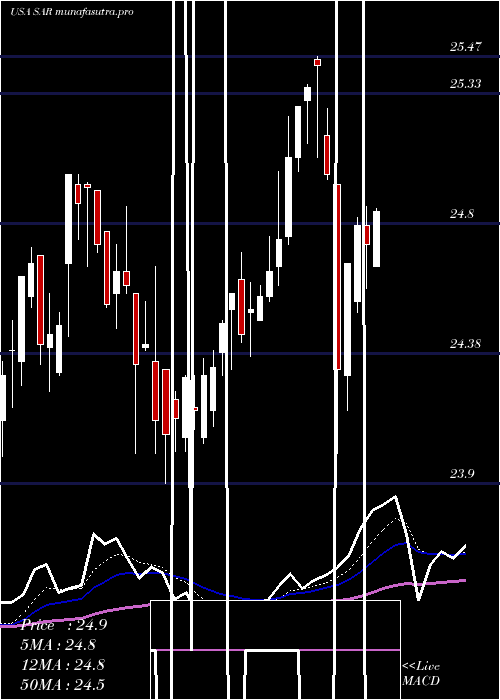
Daily price and charts and targets SaratogaInvestment Strong Daily Stock price targets for SaratogaInvestment SAR are 21.77 and 22.13 | Daily Target 1 | 21.47 | | Daily Target 2 | 21.7 | | Daily Target 3 | 21.83 | | Daily Target 4 | 22.06 | | Daily Target 5 | 22.19 |
Daily price and volume Saratoga Investment
| Date |
Closing |
Open |
Range |
Volume |
Mon 20 October 2025 |
21.93 (0.97%) |
21.75 |
21.60 - 21.96 |
0.4714 times |
Fri 17 October 2025 |
21.72 (0.74%) |
21.74 |
21.54 - 21.76 |
0.6954 times |
Thu 16 October 2025 |
21.56 (-2.75%) |
22.08 |
21.50 - 22.24 |
0.9287 times |
Wed 15 October 2025 |
22.17 (0.09%) |
22.15 |
22.08 - 22.43 |
0.7949 times |
Tue 14 October 2025 |
22.15 (1.28%) |
21.72 |
21.70 - 22.20 |
0.8649 times |
Mon 13 October 2025 |
21.87 (-6.34%) |
21.71 |
21.59 - 22.05 |
1.1255 times |
Tue 07 October 2025 |
23.35 (-4.34%) |
24.02 |
23.20 - 24.09 |
2.1973 times |
Mon 06 October 2025 |
24.41 (0.04%) |
24.60 |
24.35 - 24.63 |
1.3139 times |
Fri 03 October 2025 |
24.40 (-0.37%) |
24.51 |
24.35 - 24.76 |
1.0399 times |
Thu 02 October 2025 |
24.49 (1.62%) |
24.12 |
24.02 - 24.93 |
0.5681 times |
Wed 01 October 2025 |
24.10 (-1.19%) |
24.39 |
23.87 - 24.49 |
1.4389 times |
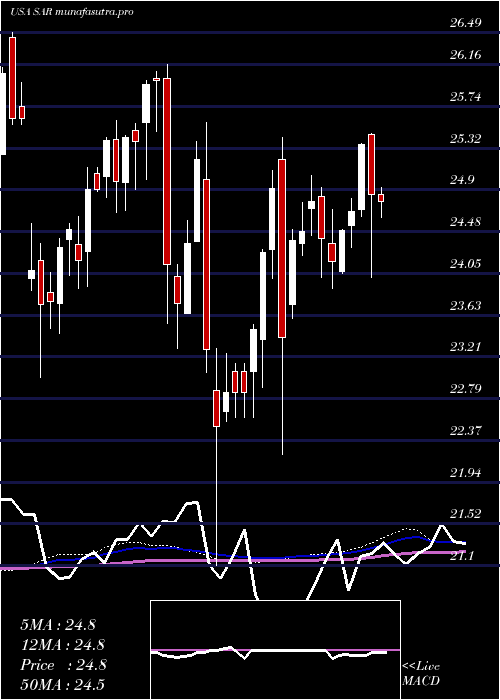
Weekly price and charts SaratogaInvestment Strong weekly Stock price targets for SaratogaInvestment SAR are 21.77 and 22.13 | Weekly Target 1 | 21.47 | | Weekly Target 2 | 21.7 | | Weekly Target 3 | 21.83 | | Weekly Target 4 | 22.06 | | Weekly Target 5 | 22.19 |
Weekly price and volumes for Saratoga Investment
| Date |
Closing |
Open |
Range |
Volume |
Mon 20 October 2025 |
21.93 (0.97%) |
21.75 |
21.60 - 21.96 |
0.1384 times |
Fri 17 October 2025 |
21.72 (-6.98%) |
21.71 |
21.50 - 22.43 |
1.2947 times |
Tue 07 October 2025 |
23.35 (-4.3%) |
24.60 |
23.20 - 24.63 |
1.0309 times |
Fri 03 October 2025 |
24.40 (0.08%) |
24.47 |
23.87 - 24.93 |
1.377 times |
Fri 26 September 2025 |
24.38 (-1.89%) |
24.85 |
24.00 - 25.15 |
1.1131 times |
Fri 19 September 2025 |
24.85 (1.39%) |
24.51 |
24.08 - 25.00 |
1.1458 times |
Fri 12 September 2025 |
24.51 (-1.13%) |
24.79 |
24.32 - 24.91 |
1.133 times |
Fri 05 September 2025 |
24.79 (-2.94%) |
25.56 |
24.60 - 25.64 |
1.4883 times |
Fri 29 August 2025 |
25.54 (0%) |
25.54 |
25.48 - 25.61 |
0.2542 times |
Fri 29 August 2025 |
25.54 (1.15%) |
25.30 |
25.19 - 25.61 |
1.0247 times |
Fri 22 August 2025 |
25.25 (-0.2%) |
25.36 |
25.20 - 25.63 |
1.0772 times |
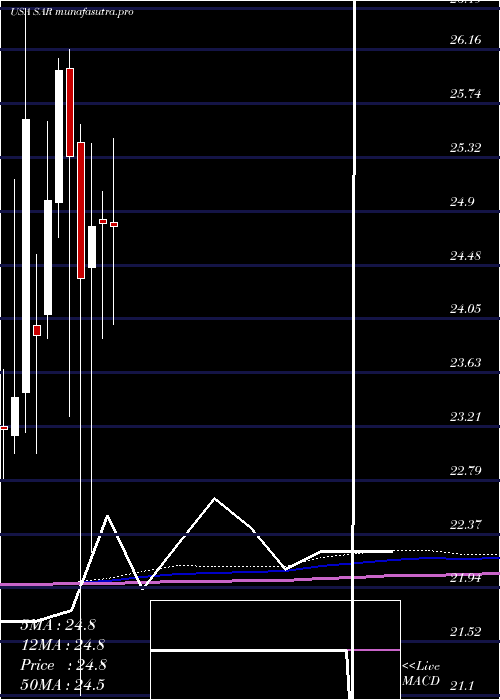
Monthly price and charts SaratogaInvestment Strong monthly Stock price targets for SaratogaInvestment SAR are 20 and 23.43 | Monthly Target 1 | 19.36 | | Monthly Target 2 | 20.64 | | Monthly Target 3 | 22.786666666667 | | Monthly Target 4 | 24.07 | | Monthly Target 5 | 26.22 |
Monthly price and volumes Saratoga Investment
| Date |
Closing |
Open |
Range |
Volume |
Mon 20 October 2025 |
21.93 (-10.09%) |
24.39 |
21.50 - 24.93 |
0.6489 times |
Tue 30 September 2025 |
24.39 (-4.5%) |
25.56 |
24.00 - 25.64 |
1.036 times |
Fri 29 August 2025 |
25.54 (3.61%) |
24.70 |
24.14 - 25.63 |
1.012 times |
Thu 31 July 2025 |
24.65 (-0.6%) |
24.81 |
24.01 - 25.60 |
1.2783 times |
Mon 30 June 2025 |
24.80 (0.08%) |
24.83 |
23.90 - 25.05 |
1.1208 times |
Fri 30 May 2025 |
24.78 (1.68%) |
24.46 |
22.22 - 25.43 |
1.0363 times |
Wed 30 April 2025 |
24.37 (-3.79%) |
25.44 |
21.10 - 25.58 |
0.7798 times |
Mon 31 March 2025 |
25.33 (-2.58%) |
26.02 |
23.29 - 26.17 |
1.012 times |
Fri 28 February 2025 |
26.00 (4.08%) |
24.97 |
24.69 - 26.10 |
1.4218 times |
Fri 31 January 2025 |
24.98 (4.43%) |
24.09 |
23.90 - 25.60 |
0.654 times |
Tue 31 December 2024 |
23.92 (-6.64%) |
24.00 |
23.00 - 24.56 |
0.4392 times |
DMA SMA EMA moving averages of Saratoga Investment SAR
DMA (daily moving average) of Saratoga Investment SAR
| DMA period | DMA value | | 5 day DMA | 21.91 | | 12 day DMA | 23.05 | | 20 day DMA | 23.65 | | 35 day DMA | 24.16 | | 50 day DMA | 24.51 | | 100 day DMA | 24.63 | | 150 day DMA | 24.4 | | 200 day DMA | 24.53 | EMA (exponential moving average) of Saratoga Investment SAR
| EMA period | EMA current | EMA prev | EMA prev2 | | 5 day EMA | 22.05 | 22.11 | 22.31 | | 12 day EMA | 22.75 | 22.9 | 23.12 | | 20 day EMA | 23.28 | 23.42 | 23.6 | | 35 day EMA | 23.84 | 23.95 | 24.08 | | 50 day EMA | 24.26 | 24.35 | 24.46 |
SMA (simple moving average) of Saratoga Investment SAR
| SMA period | SMA current | SMA prev | SMA prev2 | | 5 day SMA | 21.91 | 21.89 | 22.22 | | 12 day SMA | 23.05 | 23.23 | 23.46 | | 20 day SMA | 23.65 | 23.78 | 23.9 | | 35 day SMA | 24.16 | 24.26 | 24.37 | | 50 day SMA | 24.51 | 24.56 | 24.63 | | 100 day SMA | 24.63 | 24.65 | 24.68 | | 150 day SMA | 24.4 | 24.41 | 24.43 | | 200 day SMA | 24.53 | 24.54 | 24.55 |
|
|
