BancoSantander SAN full analysis,charts,indicators,moving averages,SMA,DMA,EMA,ADX,MACD,RSIBanco Santander SAN WideScreen charts, DMA,SMA,EMA technical analysis, forecast prediction, by indicators ADX,MACD,RSI,CCI USA stock exchange
operates under Finance sector & deals in Commercial Banks
Daily price and charts and targets BancoSantander Strong Daily Stock price targets for BancoSantander SAN are 9.85 and 9.92 | Daily Target 1 | 9.79 | | Daily Target 2 | 9.83 | | Daily Target 3 | 9.86 | | Daily Target 4 | 9.9 | | Daily Target 5 | 9.93 |
Daily price and volume Banco Santander
| Date |
Closing |
Open |
Range |
Volume |
Mon 20 October 2025 |
9.87 (1.02%) |
9.84 |
9.82 - 9.89 |
0.7175 times |
Fri 17 October 2025 |
9.77 (-1.31%) |
9.73 |
9.66 - 9.82 |
0.8536 times |
Thu 16 October 2025 |
9.90 (0.3%) |
9.89 |
9.84 - 10.02 |
1.3258 times |
Wed 15 October 2025 |
9.87 (-0.6%) |
9.94 |
9.78 - 9.98 |
0.6158 times |
Tue 14 October 2025 |
9.93 (-1.1%) |
9.87 |
9.82 - 9.99 |
1.2139 times |
Mon 13 October 2025 |
10.04 (2.97%) |
9.96 |
9.91 - 10.07 |
1.2277 times |
Fri 10 October 2025 |
9.75 (-1.91%) |
10.05 |
9.72 - 10.09 |
1.1557 times |
Thu 09 October 2025 |
9.94 (-1.68%) |
10.07 |
9.93 - 10.07 |
0.6707 times |
Wed 08 October 2025 |
10.11 (1.4%) |
10.11 |
10.08 - 10.23 |
0.9201 times |
Tue 07 October 2025 |
9.97 (-1.38%) |
10.10 |
9.96 - 10.11 |
1.2991 times |
Mon 06 October 2025 |
10.11 (-1.75%) |
10.12 |
10.06 - 10.30 |
1.497 times |
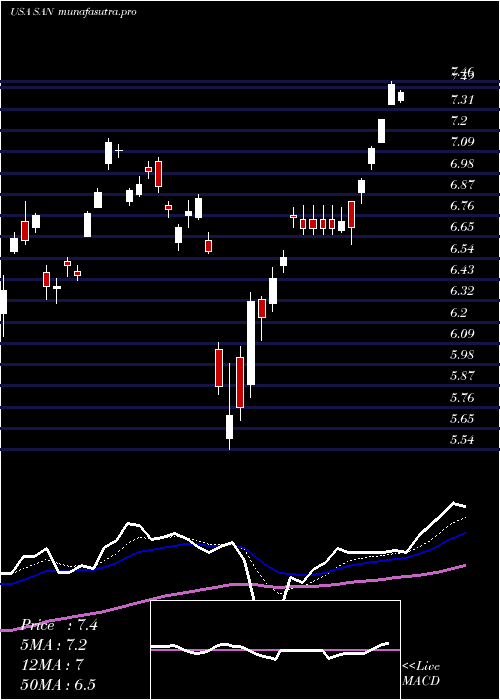
Weekly price and charts BancoSantander Strong weekly Stock price targets for BancoSantander SAN are 9.85 and 9.92 | Weekly Target 1 | 9.79 | | Weekly Target 2 | 9.83 | | Weekly Target 3 | 9.86 | | Weekly Target 4 | 9.9 | | Weekly Target 5 | 9.93 |
Weekly price and volumes for Banco Santander
| Date |
Closing |
Open |
Range |
Volume |
Mon 20 October 2025 |
9.87 (1.02%) |
9.84 |
9.82 - 9.89 |
0.1586 times |
Fri 17 October 2025 |
9.77 (0.21%) |
9.96 |
9.66 - 10.07 |
1.1574 times |
Fri 10 October 2025 |
9.75 (-5.25%) |
10.12 |
9.72 - 10.30 |
1.2249 times |
Fri 03 October 2025 |
10.29 (-0.87%) |
10.38 |
10.12 - 10.50 |
0.8643 times |
Fri 26 September 2025 |
10.38 (1.37%) |
10.13 |
10.05 - 10.40 |
0.9876 times |
Fri 19 September 2025 |
10.24 (1.89%) |
10.12 |
9.96 - 10.29 |
1.7453 times |
Fri 12 September 2025 |
10.05 (5.46%) |
9.66 |
9.66 - 10.09 |
1.5083 times |
Fri 05 September 2025 |
9.53 (0%) |
9.36 |
9.31 - 9.65 |
0.7028 times |
Fri 29 August 2025 |
9.53 (0%) |
9.53 |
9.50 - 9.58 |
0.3559 times |
Fri 29 August 2025 |
9.53 (-2.66%) |
9.73 |
9.31 - 9.79 |
1.295 times |
Fri 22 August 2025 |
9.79 (1.56%) |
9.54 |
9.45 - 9.82 |
1.0667 times |
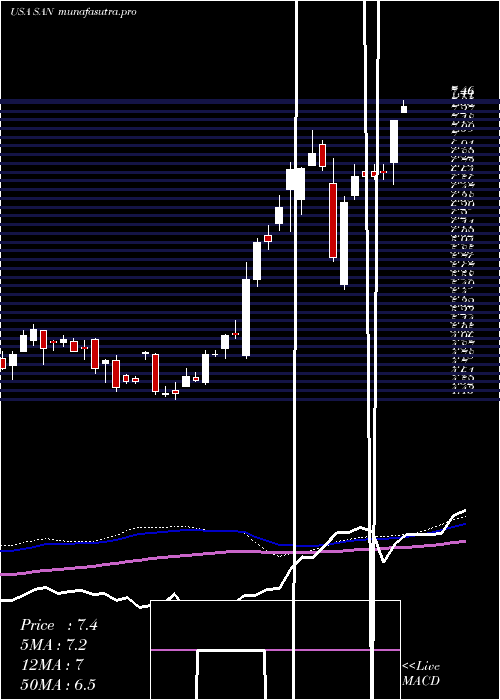
Monthly price and charts BancoSantander Strong monthly Stock price targets for BancoSantander SAN are 9.37 and 10.17 | Monthly Target 1 | 9.2 | | Monthly Target 2 | 9.53 | | Monthly Target 3 | 9.9966666666667 | | Monthly Target 4 | 10.33 | | Monthly Target 5 | 10.8 |
Monthly price and volumes Banco Santander
| Date |
Closing |
Open |
Range |
Volume |
Mon 20 October 2025 |
9.87 (-5.82%) |
10.44 |
9.66 - 10.46 |
0.4664 times |
Tue 30 September 2025 |
10.48 (9.97%) |
9.36 |
9.31 - 10.50 |
0.806 times |
Fri 29 August 2025 |
9.53 (10.69%) |
8.40 |
8.29 - 9.82 |
0.8307 times |
Thu 31 July 2025 |
8.61 (3.73%) |
8.24 |
8.21 - 8.98 |
1.4454 times |
Mon 30 June 2025 |
8.30 (4.14%) |
7.95 |
7.82 - 8.30 |
1.2664 times |
Fri 30 May 2025 |
7.97 (13.86%) |
6.98 |
6.93 - 8.08 |
0.9678 times |
Wed 30 April 2025 |
7.00 (4.48%) |
6.76 |
5.54 - 7.46 |
1.3571 times |
Mon 31 March 2025 |
6.70 (5.02%) |
6.56 |
6.13 - 7.16 |
1.233 times |
Fri 28 February 2025 |
6.38 (25.34%) |
4.88 |
4.85 - 6.50 |
0.9716 times |
Fri 31 January 2025 |
5.09 (11.62%) |
4.47 |
4.43 - 5.23 |
0.6556 times |
Tue 31 December 2024 |
4.56 (-1.08%) |
4.90 |
4.46 - 4.92 |
0.445 times |

DMA SMA EMA moving averages of Banco Santander SAN
DMA (daily moving average) of Banco Santander SAN
| DMA period | DMA value | | 5 day DMA | 9.87 | | 12 day DMA | 9.96 | | 20 day DMA | 10.1 | | 35 day DMA | 10.01 | | 50 day DMA | 9.88 | | 100 day DMA | 9.13 | | 150 day DMA | 8.43 | | 200 day DMA | 7.72 | EMA (exponential moving average) of Banco Santander SAN
| EMA period | EMA current | EMA prev | EMA prev2 | | 5 day EMA | 9.88 | 9.88 | 9.93 | | 12 day EMA | 9.95 | 9.96 | 10 | | 20 day EMA | 10 | 10.01 | 10.03 | | 35 day EMA | 9.92 | 9.92 | 9.93 | | 50 day EMA | 9.81 | 9.81 | 9.81 |
SMA (simple moving average) of Banco Santander SAN
| SMA period | SMA current | SMA prev | SMA prev2 | | 5 day SMA | 9.87 | 9.9 | 9.9 | | 12 day SMA | 9.96 | 9.99 | 10.04 | | 20 day SMA | 10.1 | 10.12 | 10.14 | | 35 day SMA | 10.01 | 10 | 9.99 | | 50 day SMA | 9.88 | 9.87 | 9.86 | | 100 day SMA | 9.13 | 9.12 | 9.1 | | 150 day SMA | 8.43 | 8.41 | 8.39 | | 200 day SMA | 7.72 | 7.7 | 7.67 |
|
|
