RayonierInc RYN full analysis,charts,indicators,moving averages,SMA,DMA,EMA,ADX,MACD,RSIRayonier Inc RYN WideScreen charts, DMA,SMA,EMA technical analysis, forecast prediction, by indicators ADX,MACD,RSI,CCI USA stock exchange
operates under Consumer Services sector & deals in Real Estate Investment Trusts
Daily price and charts and targets RayonierInc Strong Daily Stock price targets for RayonierInc RYN are 21.33 and 21.6 | Daily Target 1 | 21.11 | | Daily Target 2 | 21.28 | | Daily Target 3 | 21.383333333333 | | Daily Target 4 | 21.55 | | Daily Target 5 | 21.65 |
Daily price and volume Rayonier Inc
| Date |
Closing |
Open |
Range |
Volume |
Thu 04 December 2025 |
21.44 (0.7%) |
21.32 |
21.22 - 21.49 |
1.1958 times |
Wed 03 December 2025 |
21.29 (-0.65%) |
21.51 |
21.19 - 21.67 |
1.0858 times |
Tue 02 December 2025 |
21.43 (-0.92%) |
21.86 |
21.43 - 21.86 |
0.9256 times |
Mon 01 December 2025 |
21.63 (-2.61%) |
21.96 |
21.59 - 22.13 |
0.91 times |
Fri 28 November 2025 |
22.21 (1.28%) |
21.99 |
21.96 - 22.29 |
0.3929 times |
Wed 26 November 2025 |
21.93 (0.14%) |
21.90 |
21.82 - 22.22 |
0.7903 times |
Tue 25 November 2025 |
21.90 (1.72%) |
21.70 |
21.61 - 21.98 |
0.865 times |
Mon 24 November 2025 |
21.53 (-1.78%) |
21.95 |
21.38 - 21.95 |
1.541 times |
Fri 21 November 2025 |
21.92 (1.86%) |
21.59 |
21.52 - 22.15 |
1.0105 times |
Thu 20 November 2025 |
21.52 (1.03%) |
21.36 |
21.27 - 21.72 |
1.283 times |
Wed 19 November 2025 |
21.30 (-0.28%) |
21.40 |
21.06 - 21.44 |
1.2102 times |
Weekly price and charts RayonierInc Strong weekly Stock price targets for RayonierInc RYN are 20.85 and 21.79 | Weekly Target 1 | 20.65 | | Weekly Target 2 | 21.04 | | Weekly Target 3 | 21.586666666667 | | Weekly Target 4 | 21.98 | | Weekly Target 5 | 22.53 |
Weekly price and volumes for Rayonier Inc
| Date |
Closing |
Open |
Range |
Volume |
Thu 04 December 2025 |
21.44 (-3.47%) |
21.96 |
21.19 - 22.13 |
0.815 times |
Fri 28 November 2025 |
22.21 (1.32%) |
21.95 |
21.38 - 22.29 |
0.7104 times |
Fri 21 November 2025 |
21.92 (0.6%) |
21.74 |
21.06 - 22.15 |
1.398 times |
Fri 14 November 2025 |
21.79 (-5.38%) |
23.00 |
21.69 - 23.05 |
1.1265 times |
Fri 07 November 2025 |
23.03 (4.35%) |
21.64 |
21.23 - 23.33 |
1.4067 times |
Fri 31 October 2025 |
22.07 (0%) |
22.45 |
21.89 - 22.56 |
0.2967 times |
Fri 31 October 2025 |
22.07 (-5.28%) |
23.34 |
21.89 - 23.48 |
1.2237 times |
Fri 24 October 2025 |
23.30 (-6.46%) |
25.08 |
23.08 - 25.13 |
1.1339 times |
Fri 17 October 2025 |
24.91 (-5.46%) |
25.63 |
24.09 - 25.97 |
1.6418 times |
Tue 07 October 2025 |
26.35 (-2.04%) |
26.90 |
26.24 - 27.02 |
0.2473 times |
Fri 03 October 2025 |
26.90 (1.7%) |
26.50 |
26.15 - 27.45 |
0.6168 times |

Monthly price and charts RayonierInc Strong monthly Stock price targets for RayonierInc RYN are 20.85 and 21.79 | Monthly Target 1 | 20.65 | | Monthly Target 2 | 21.04 | | Monthly Target 3 | 21.586666666667 | | Monthly Target 4 | 21.98 | | Monthly Target 5 | 22.53 |
Monthly price and volumes Rayonier Inc
| Date |
Closing |
Open |
Range |
Volume |
Thu 04 December 2025 |
21.44 (-3.47%) |
21.96 |
21.19 - 22.13 |
0.2143 times |
Fri 28 November 2025 |
22.21 (0.63%) |
21.64 |
21.06 - 23.33 |
1.2203 times |
Fri 31 October 2025 |
22.07 (-16.84%) |
26.59 |
21.89 - 27.45 |
1.274 times |
Tue 30 September 2025 |
26.54 (0.99%) |
26.02 |
25.47 - 26.96 |
1.0549 times |
Fri 29 August 2025 |
26.28 (12.74%) |
23.53 |
23.18 - 27.34 |
1.0122 times |
Thu 31 July 2025 |
23.31 (5.09%) |
22.01 |
21.97 - 24.57 |
1.1273 times |
Mon 30 June 2025 |
22.18 (-6.41%) |
23.46 |
21.84 - 24.30 |
0.9132 times |
Fri 30 May 2025 |
23.70 (-3.11%) |
23.99 |
22.81 - 24.22 |
1.1278 times |
Wed 30 April 2025 |
24.46 (-12.27%) |
27.97 |
22.80 - 28.14 |
1.0177 times |
Mon 31 March 2025 |
27.88 (5.25%) |
26.45 |
26.28 - 28.31 |
1.0385 times |
Fri 28 February 2025 |
26.49 (1.34%) |
25.90 |
25.10 - 27.11 |
1.1795 times |

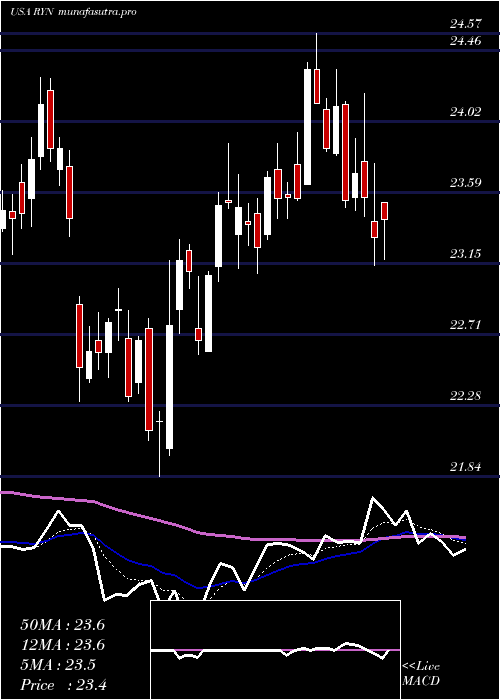
DMA SMA EMA moving averages of Rayonier Inc RYN
DMA (daily moving average) of Rayonier Inc RYN
| DMA period | DMA value | | 5 day DMA | 21.6 | | 12 day DMA | 21.62 | | 20 day DMA | 21.87 | | 35 day DMA | 22.53 | | 50 day DMA | 23.59 | | 100 day DMA | 24.47 | | 150 day DMA | 24.11 | | 200 day DMA | 24.65 | EMA (exponential moving average) of Rayonier Inc RYN
| EMA period | EMA current | EMA prev | EMA prev2 | | 5 day EMA | 21.52 | 21.56 | 21.7 | | 12 day EMA | 21.7 | 21.75 | 21.83 | | 20 day EMA | 21.97 | 22.03 | 22.11 | | 35 day EMA | 22.77 | 22.85 | 22.94 | | 50 day EMA | 23.57 | 23.66 | 23.76 |
SMA (simple moving average) of Rayonier Inc RYN
| SMA period | SMA current | SMA prev | SMA prev2 | | 5 day SMA | 21.6 | 21.7 | 21.82 | | 12 day SMA | 21.62 | 21.63 | 21.67 | | 20 day SMA | 21.87 | 21.9 | 21.93 | | 35 day SMA | 22.53 | 22.6 | 22.69 | | 50 day SMA | 23.59 | 23.67 | 23.77 | | 100 day SMA | 24.47 | 24.49 | 24.51 | | 150 day SMA | 24.11 | 24.13 | 24.16 | | 200 day SMA | 24.65 | 24.67 | 24.69 |
|
|
