RedwoodTrust RWT full analysis,charts,indicators,moving averages,SMA,DMA,EMA,ADX,MACD,RSIRedwood Trust RWT WideScreen charts, DMA,SMA,EMA technical analysis, forecast prediction, by indicators ADX,MACD,RSI,CCI USA stock exchange
operates under Consumer Services sector & deals in Real Estate Investment Trusts
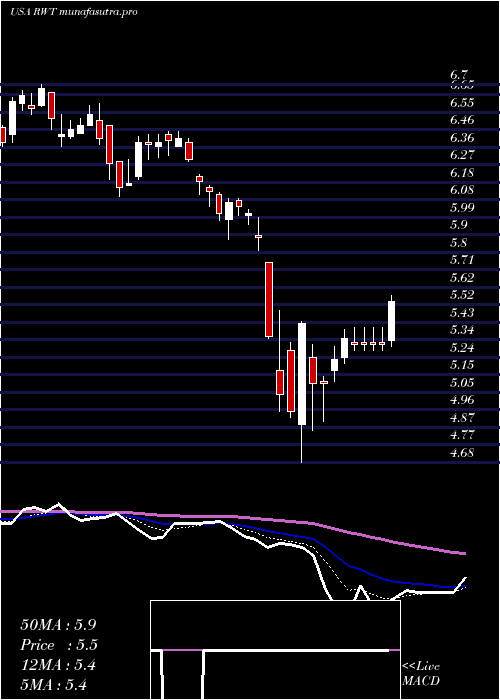
Daily price and charts and targets RedwoodTrust Strong Daily Stock price targets for RedwoodTrust RWT are 5.47 and 5.54 | Daily Target 1 | 5.41 | | Daily Target 2 | 5.45 | | Daily Target 3 | 5.48 | | Daily Target 4 | 5.52 | | Daily Target 5 | 5.55 |
Daily price and volume Redwood Trust
| Date |
Closing |
Open |
Range |
Volume |
Fri 17 October 2025 |
5.49 (0%) |
5.48 |
5.44 - 5.51 |
1.0298 times |
Thu 16 October 2025 |
5.49 (-3.35%) |
5.67 |
5.48 - 5.70 |
1.3887 times |
Wed 15 October 2025 |
5.68 (-0.53%) |
5.73 |
5.68 - 5.78 |
0.9614 times |
Tue 14 October 2025 |
5.71 (1.42%) |
5.61 |
5.58 - 5.74 |
0.7659 times |
Mon 13 October 2025 |
5.63 (1.44%) |
5.59 |
5.55 - 5.66 |
0.7691 times |
Fri 10 October 2025 |
5.55 (-0.72%) |
5.62 |
5.53 - 5.67 |
1.1673 times |
Thu 09 October 2025 |
5.59 (-3.62%) |
5.80 |
5.58 - 5.82 |
1.4356 times |
Wed 08 October 2025 |
5.80 (0.87%) |
5.78 |
5.77 - 5.83 |
0.6455 times |
Tue 07 October 2025 |
5.75 (-0.69%) |
5.79 |
5.73 - 5.82 |
0.894 times |
Mon 06 October 2025 |
5.79 (-2.03%) |
5.91 |
5.78 - 5.95 |
0.9426 times |
Fri 03 October 2025 |
5.91 (1.2%) |
5.85 |
5.85 - 6.01 |
1.3023 times |
Weekly price and charts RedwoodTrust Strong weekly Stock price targets for RedwoodTrust RWT are 5.3 and 5.64 | Weekly Target 1 | 5.23 | | Weekly Target 2 | 5.36 | | Weekly Target 3 | 5.57 | | Weekly Target 4 | 5.7 | | Weekly Target 5 | 5.91 |
Weekly price and volumes for Redwood Trust
| Date |
Closing |
Open |
Range |
Volume |
Fri 17 October 2025 |
5.49 (-1.08%) |
5.59 |
5.44 - 5.78 |
0.8522 times |
Fri 10 October 2025 |
5.55 (-6.09%) |
5.91 |
5.53 - 5.95 |
0.8817 times |
Fri 03 October 2025 |
5.91 (2.78%) |
5.75 |
5.66 - 6.01 |
1.2204 times |
Fri 26 September 2025 |
5.75 (-4.49%) |
6.01 |
5.68 - 6.02 |
1.3889 times |
Fri 19 September 2025 |
6.02 (-3.22%) |
6.30 |
6.00 - 6.30 |
1.4871 times |
Fri 12 September 2025 |
6.22 (-2.35%) |
6.34 |
6.13 - 6.37 |
0.966 times |
Fri 05 September 2025 |
6.37 (4.08%) |
6.01 |
5.94 - 6.47 |
0.9209 times |
Fri 29 August 2025 |
6.12 (0%) |
6.04 |
6.02 - 6.12 |
0.1956 times |
Fri 29 August 2025 |
6.12 (0.16%) |
6.04 |
5.95 - 6.12 |
0.9271 times |
Fri 22 August 2025 |
6.11 (3.04%) |
5.93 |
5.86 - 6.16 |
1.1603 times |
Fri 15 August 2025 |
5.93 (3.31%) |
5.74 |
5.73 - 6.08 |
1.4696 times |

Monthly price and charts RedwoodTrust Strong monthly Stock price targets for RedwoodTrust RWT are 5.18 and 5.75 | Monthly Target 1 | 5.08 | | Monthly Target 2 | 5.28 | | Monthly Target 3 | 5.6466666666667 | | Monthly Target 4 | 5.85 | | Monthly Target 5 | 6.22 |
Monthly price and volumes Redwood Trust
| Date |
Closing |
Open |
Range |
Volume |
Fri 17 October 2025 |
5.49 (-5.18%) |
5.81 |
5.44 - 6.01 |
0.4971 times |
Tue 30 September 2025 |
5.79 (-5.39%) |
6.01 |
5.66 - 6.47 |
1.1507 times |
Fri 29 August 2025 |
6.12 (12.09%) |
5.49 |
5.35 - 6.16 |
1.1881 times |
Thu 31 July 2025 |
5.46 (-7.61%) |
5.89 |
5.43 - 6.20 |
1.1082 times |
Mon 30 June 2025 |
5.91 (8.44%) |
5.40 |
5.35 - 5.96 |
1.0112 times |
Fri 30 May 2025 |
5.45 (-12.24%) |
6.22 |
5.37 - 6.24 |
0.8412 times |
Wed 30 April 2025 |
6.21 (2.31%) |
6.08 |
4.68 - 6.27 |
1.583 times |
Mon 31 March 2025 |
6.07 (-9.13%) |
6.66 |
5.87 - 6.66 |
0.8764 times |
Fri 28 February 2025 |
6.68 (1.98%) |
6.45 |
5.83 - 6.73 |
0.7823 times |
Fri 31 January 2025 |
6.55 (0.31%) |
6.55 |
6.01 - 6.66 |
0.9618 times |
Tue 31 December 2024 |
6.53 (-8.29%) |
7.14 |
6.38 - 7.19 |
1.2401 times |

DMA SMA EMA moving averages of Redwood Trust RWT
DMA (daily moving average) of Redwood Trust RWT
| DMA period | DMA value | | 5 day DMA | 5.6 | | 12 day DMA | 5.69 | | 20 day DMA | 5.74 | | 35 day DMA | 5.92 | | 50 day DMA | 5.94 | | 100 day DMA | 5.87 | | 150 day DMA | 5.84 | | 200 day DMA | 6 | EMA (exponential moving average) of Redwood Trust RWT
| EMA period | EMA current | EMA prev | EMA prev2 | | 5 day EMA | 5.58 | 5.62 | 5.68 | | 12 day EMA | 5.66 | 5.69 | 5.73 | | 20 day EMA | 5.73 | 5.75 | 5.78 | | 35 day EMA | 5.79 | 5.81 | 5.83 | | 50 day EMA | 5.87 | 5.89 | 5.91 |
SMA (simple moving average) of Redwood Trust RWT
| SMA period | SMA current | SMA prev | SMA prev2 | | 5 day SMA | 5.6 | 5.61 | 5.63 | | 12 day SMA | 5.69 | 5.72 | 5.74 | | 20 day SMA | 5.74 | 5.76 | 5.79 | | 35 day SMA | 5.92 | 5.93 | 5.95 | | 50 day SMA | 5.94 | 5.94 | 5.95 | | 100 day SMA | 5.87 | 5.87 | 5.87 | | 150 day SMA | 5.84 | 5.85 | 5.85 | | 200 day SMA | 6 | 6 | 6.01 |
|
|
