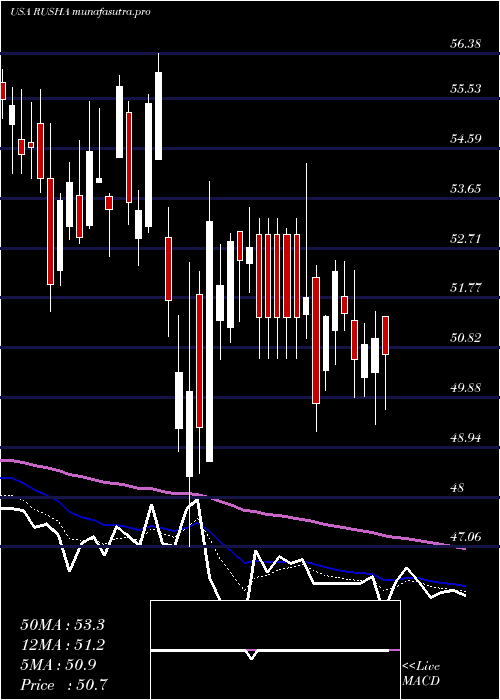
RushEnterprises RUSHA full analysis,charts,indicators,moving averages,SMA,DMA,EMA,ADX,MACD,RSIRush Enterprises RUSHA WideScreen charts, DMA,SMA,EMA technical analysis, forecast prediction, by indicators ADX,MACD,RSI,CCI USA stock exchange
operates under Consumer Durables sector & deals in Automotive Aftermarket
Daily price and charts and targets RushEnterprises Strong Daily Stock price targets for RushEnterprises RUSHA are 54.46 and 55.78 | Daily Target 1 | 53.42 | | Daily Target 2 | 54.17 | | Daily Target 3 | 54.74 | | Daily Target 4 | 55.49 | | Daily Target 5 | 56.06 |
Daily price and volume Rush Enterprises
| Date |
Closing |
Open |
Range |
Volume |
Fri 05 December 2025 |
54.92 (0.46%) |
54.41 |
53.99 - 55.31 |
0.5354 times |
Thu 04 December 2025 |
54.67 (1.09%) |
54.73 |
54.52 - 55.35 |
0.8231 times |
Wed 03 December 2025 |
54.08 (2.15%) |
53.04 |
52.96 - 54.30 |
0.7318 times |
Tue 02 December 2025 |
52.94 (0.44%) |
52.73 |
51.97 - 53.21 |
1.1549 times |
Mon 01 December 2025 |
52.71 (1.25%) |
51.67 |
51.42 - 52.83 |
1.0618 times |
Fri 28 November 2025 |
52.06 (-0.44%) |
52.29 |
51.26 - 52.55 |
0.4443 times |
Wed 26 November 2025 |
52.29 (0.93%) |
51.21 |
51.21 - 52.60 |
1.6883 times |
Tue 25 November 2025 |
51.81 (2.55%) |
50.90 |
50.86 - 52.00 |
1.0216 times |
Mon 24 November 2025 |
50.52 (-0.81%) |
50.86 |
50.50 - 51.35 |
1.0924 times |
Fri 21 November 2025 |
50.93 (4.99%) |
48.69 |
48.69 - 51.31 |
1.4465 times |
Thu 20 November 2025 |
48.51 (0.37%) |
48.82 |
48.23 - 49.56 |
5.2021 times |
Weekly price and charts RushEnterprises Strong weekly Stock price targets for RushEnterprises RUSHA are 53.17 and 57.1 | Weekly Target 1 | 49.97 | | Weekly Target 2 | 52.44 | | Weekly Target 3 | 53.896666666667 | | Weekly Target 4 | 56.37 | | Weekly Target 5 | 57.83 |
Weekly price and volumes for Rush Enterprises
| Date |
Closing |
Open |
Range |
Volume |
Fri 05 December 2025 |
54.92 (5.49%) |
51.67 |
51.42 - 55.35 |
0.7124 times |
Fri 28 November 2025 |
52.06 (2.22%) |
50.86 |
50.50 - 52.60 |
0.7024 times |
Fri 21 November 2025 |
50.93 (7.63%) |
46.96 |
46.41 - 51.31 |
1.8501 times |
Fri 14 November 2025 |
47.32 (-3.05%) |
49.04 |
47.13 - 50.41 |
1.5843 times |
Fri 07 November 2025 |
48.81 (-1.21%) |
46.94 |
45.67 - 48.90 |
1.1455 times |
Fri 31 October 2025 |
49.41 (0%) |
49.76 |
48.63 - 50.04 |
0.3576 times |
Fri 31 October 2025 |
49.41 (-2.37%) |
50.81 |
48.63 - 53.17 |
1.2464 times |
Fri 24 October 2025 |
50.61 (-0.59%) |
51.09 |
50.35 - 51.80 |
0.9095 times |
Fri 17 October 2025 |
50.91 (1.11%) |
50.80 |
50.01 - 52.33 |
0.657 times |
Fri 10 October 2025 |
50.35 (-2.61%) |
51.73 |
49.45 - 52.02 |
0.8348 times |
Fri 03 October 2025 |
51.70 (-8.17%) |
56.75 |
51.40 - 57.14 |
0.9989 times |

Monthly price and charts RushEnterprises Strong monthly Stock price targets for RushEnterprises RUSHA are 53.17 and 57.1 | Monthly Target 1 | 49.97 | | Monthly Target 2 | 52.44 | | Monthly Target 3 | 53.896666666667 | | Monthly Target 4 | 56.37 | | Monthly Target 5 | 57.83 |
Monthly price and volumes Rush Enterprises
| Date |
Closing |
Open |
Range |
Volume |
Fri 05 December 2025 |
54.92 (5.49%) |
51.67 |
51.42 - 55.35 |
0.2173 times |
Fri 28 November 2025 |
52.06 (5.36%) |
46.94 |
45.67 - 52.60 |
1.6115 times |
Fri 31 October 2025 |
49.41 (-7.59%) |
53.23 |
48.63 - 54.36 |
1.3919 times |
Tue 30 September 2025 |
53.47 (-6.85%) |
56.68 |
53.23 - 59.35 |
0.8726 times |
Fri 29 August 2025 |
57.40 (6.02%) |
53.46 |
52.37 - 59.37 |
0.714 times |
Thu 31 July 2025 |
54.14 (5.11%) |
51.39 |
50.41 - 55.97 |
1.0696 times |
Mon 30 June 2025 |
51.51 (3.75%) |
49.37 |
48.66 - 52.40 |
0.9509 times |
Fri 30 May 2025 |
49.65 (-2.63%) |
51.42 |
47.47 - 52.66 |
1.1029 times |
Wed 30 April 2025 |
50.99 (-4.53%) |
53.12 |
47.06 - 56.38 |
1.3005 times |
Mon 31 March 2025 |
53.41 (-8.42%) |
58.45 |
51.50 - 58.98 |
0.7687 times |
Fri 28 February 2025 |
58.32 (-4%) |
59.09 |
55.06 - 65.43 |
0.7529 times |

DMA SMA EMA moving averages of Rush Enterprises RUSHA
DMA (daily moving average) of Rush Enterprises RUSHA
| DMA period | DMA value | | 5 day DMA | 53.86 | | 12 day DMA | 51.98 | | 20 day DMA | 50.56 | | 35 day DMA | 50.24 | | 50 day DMA | 50.72 | | 100 day DMA | 53.46 | | 150 day DMA | 52.64 | | 200 day DMA | 52.85 | EMA (exponential moving average) of Rush Enterprises RUSHA
| EMA period | EMA current | EMA prev | EMA prev2 | | 5 day EMA | 53.93 | 53.43 | 52.81 | | 12 day EMA | 52.41 | 51.95 | 51.45 | | 20 day EMA | 51.57 | 51.22 | 50.86 | | 35 day EMA | 51.44 | 51.23 | 51.03 | | 50 day EMA | 51.61 | 51.47 | 51.34 |
SMA (simple moving average) of Rush Enterprises RUSHA
| SMA period | SMA current | SMA prev | SMA prev2 | | 5 day SMA | 53.86 | 53.29 | 52.82 | | 12 day SMA | 51.98 | 51.36 | 50.7 | | 20 day SMA | 50.56 | 50.18 | 49.8 | | 35 day SMA | 50.24 | 50.13 | 50.03 | | 50 day SMA | 50.72 | 50.77 | 50.84 | | 100 day SMA | 53.46 | 53.43 | 53.41 | | 150 day SMA | 52.64 | 52.62 | 52.59 | | 200 day SMA | 52.85 | 52.88 | 52.91 |
|
|
