SunrunInc RUN full analysis,charts,indicators,moving averages,SMA,DMA,EMA,ADX,MACD,RSISunrun Inc RUN WideScreen charts, DMA,SMA,EMA technical analysis, forecast prediction, by indicators ADX,MACD,RSI,CCI USA stock exchange
operates under Capital Goods sector & deals in Industrial Specialties
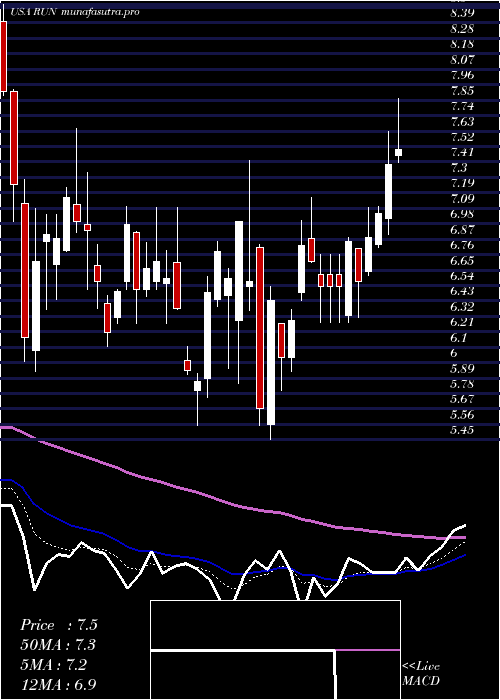
Daily price and charts and targets SunrunInc Strong Daily Stock price targets for SunrunInc RUN are 17.97 and 18.84 | Daily Target 1 | 17.27 | | Daily Target 2 | 17.8 | | Daily Target 3 | 18.136666666667 | | Daily Target 4 | 18.67 | | Daily Target 5 | 19.01 |
Daily price and volume Sunrun Inc
| Date |
Closing |
Open |
Range |
Volume |
Thu 04 December 2025 |
18.34 (2.75%) |
17.98 |
17.60 - 18.47 |
0.6081 times |
Wed 03 December 2025 |
17.85 (-1.82%) |
18.08 |
17.35 - 18.08 |
1.3333 times |
Tue 02 December 2025 |
18.18 (-1.99%) |
18.76 |
18.08 - 18.92 |
0.632 times |
Mon 01 December 2025 |
18.55 (-8.4%) |
19.58 |
18.52 - 19.89 |
1.179 times |
Fri 28 November 2025 |
20.25 (5.36%) |
19.38 |
19.29 - 20.31 |
0.7965 times |
Wed 26 November 2025 |
19.22 (3.11%) |
18.61 |
18.35 - 19.55 |
0.6637 times |
Tue 25 November 2025 |
18.64 (3.04%) |
18.08 |
17.75 - 18.82 |
0.5917 times |
Mon 24 November 2025 |
18.09 (0.89%) |
18.03 |
17.74 - 18.69 |
0.9127 times |
Fri 21 November 2025 |
17.93 (0.67%) |
17.96 |
16.89 - 18.56 |
1.1445 times |
Thu 20 November 2025 |
17.81 (-6.02%) |
19.53 |
17.77 - 20.99 |
2.1385 times |
Wed 19 November 2025 |
18.95 (-1.25%) |
19.27 |
18.75 - 19.97 |
1.9099 times |
Weekly price and charts SunrunInc Strong weekly Stock price targets for SunrunInc RUN are 16.58 and 19.12 | Weekly Target 1 | 15.99 | | Weekly Target 2 | 17.16 | | Weekly Target 3 | 18.526666666667 | | Weekly Target 4 | 19.7 | | Weekly Target 5 | 21.07 |
Weekly price and volumes for Sunrun Inc
| Date |
Closing |
Open |
Range |
Volume |
Thu 04 December 2025 |
18.34 (-9.43%) |
19.58 |
17.35 - 19.89 |
0.6748 times |
Fri 28 November 2025 |
20.25 (12.94%) |
18.03 |
17.74 - 20.31 |
0.5331 times |
Fri 21 November 2025 |
17.93 (-3.86%) |
18.62 |
16.89 - 20.99 |
1.5046 times |
Fri 14 November 2025 |
18.65 (9%) |
18.34 |
17.50 - 20.45 |
1.46 times |
Fri 07 November 2025 |
17.11 (-17.58%) |
19.00 |
15.92 - 21.34 |
1.2588 times |
Fri 31 October 2025 |
20.76 (0%) |
19.78 |
19.75 - 21.03 |
0.2138 times |
Fri 31 October 2025 |
20.76 (-0.43%) |
21.25 |
19.53 - 21.38 |
0.9887 times |
Fri 24 October 2025 |
20.85 (5.36%) |
19.91 |
18.77 - 21.80 |
0.8551 times |
Fri 17 October 2025 |
19.79 (5.27%) |
19.44 |
19.00 - 22.44 |
1.1001 times |
Fri 10 October 2025 |
18.80 (-1.52%) |
19.47 |
18.10 - 21.08 |
1.4109 times |
Fri 03 October 2025 |
19.09 (8.04%) |
17.75 |
16.83 - 20.02 |
1.9928 times |
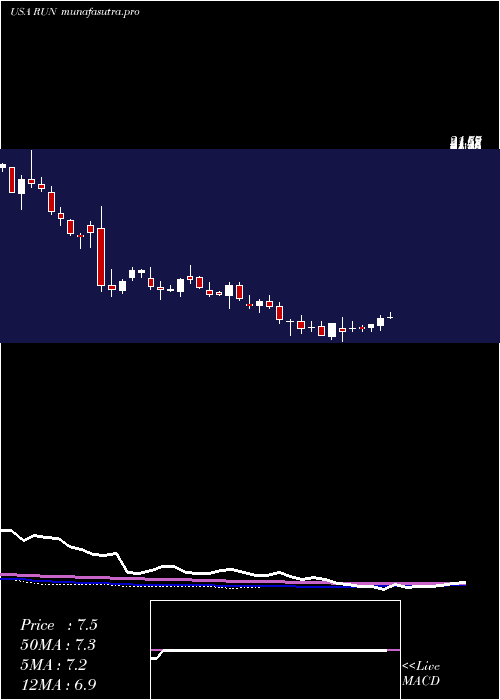
Monthly price and charts SunrunInc Strong monthly Stock price targets for SunrunInc RUN are 16.58 and 19.12 | Monthly Target 1 | 15.99 | | Monthly Target 2 | 17.16 | | Monthly Target 3 | 18.526666666667 | | Monthly Target 4 | 19.7 | | Monthly Target 5 | 21.07 |
Monthly price and volumes Sunrun Inc
| Date |
Closing |
Open |
Range |
Volume |
Thu 04 December 2025 |
18.34 (-9.43%) |
19.58 |
17.35 - 19.89 |
0.0742 times |
Fri 28 November 2025 |
20.25 (-2.46%) |
19.00 |
15.92 - 21.34 |
0.5234 times |
Fri 31 October 2025 |
20.76 (20.07%) |
18.51 |
17.93 - 22.44 |
0.6548 times |
Tue 30 September 2025 |
17.29 (8.27%) |
15.06 |
14.95 - 18.32 |
0.7268 times |
Fri 29 August 2025 |
15.97 (55.65%) |
10.03 |
9.01 - 16.90 |
1.3478 times |
Thu 31 July 2025 |
10.26 (25.43%) |
8.20 |
7.84 - 11.88 |
1.3436 times |
Mon 30 June 2025 |
8.18 (9.21%) |
7.50 |
5.38 - 10.14 |
1.95 times |
Fri 30 May 2025 |
7.49 (8.71%) |
6.94 |
6.16 - 13.23 |
1.7258 times |
Wed 30 April 2025 |
6.89 (17.58%) |
5.88 |
5.45 - 7.86 |
0.8489 times |
Mon 31 March 2025 |
5.86 (-19.17%) |
7.12 |
5.55 - 7.65 |
0.8048 times |
Fri 28 February 2025 |
7.25 (-19.89%) |
8.57 |
6.99 - 9.31 |
0.6328 times |

DMA SMA EMA moving averages of Sunrun Inc RUN
DMA (daily moving average) of Sunrun Inc RUN
| DMA period | DMA value | | 5 day DMA | 18.63 | | 12 day DMA | 18.58 | | 20 day DMA | 18.71 | | 35 day DMA | 19.33 | | 50 day DMA | 19.27 | | 100 day DMA | 16.55 | | 150 day DMA | 13.96 | | 200 day DMA | 12.22 | EMA (exponential moving average) of Sunrun Inc RUN
| EMA period | EMA current | EMA prev | EMA prev2 | | 5 day EMA | 18.39 | 18.42 | 18.71 | | 12 day EMA | 18.6 | 18.65 | 18.8 | | 20 day EMA | 18.77 | 18.81 | 18.91 | | 35 day EMA | 18.83 | 18.86 | 18.92 | | 50 day EMA | 18.97 | 19 | 19.05 |
SMA (simple moving average) of Sunrun Inc RUN
| SMA period | SMA current | SMA prev | SMA prev2 | | 5 day SMA | 18.63 | 18.81 | 18.97 | | 12 day SMA | 18.58 | 18.6 | 18.67 | | 20 day SMA | 18.71 | 18.82 | 18.88 | | 35 day SMA | 19.33 | 19.42 | 19.5 | | 50 day SMA | 19.27 | 19.22 | 19.19 | | 100 day SMA | 16.55 | 16.47 | 16.4 | | 150 day SMA | 13.96 | 13.88 | 13.81 | | 200 day SMA | 12.22 | 12.17 | 12.12 |
|
|
