RedRock RRR full analysis,charts,indicators,moving averages,SMA,DMA,EMA,ADX,MACD,RSIRed Rock RRR WideScreen charts, DMA,SMA,EMA technical analysis, forecast prediction, by indicators ADX,MACD,RSI,CCI USA stock exchange
operates under Consumer Services sector & deals in Hotels Resorts
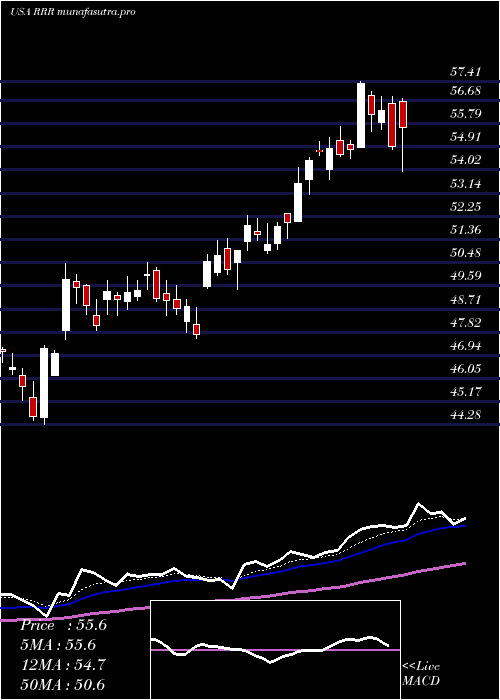
Daily price and charts and targets RedRock Strong Daily Stock price targets for RedRock RRR are 55.18 and 57.38 | Daily Target 1 | 54.79 | | Daily Target 2 | 55.56 | | Daily Target 3 | 56.99 | | Daily Target 4 | 57.76 | | Daily Target 5 | 59.19 |
Daily price and volume Red Rock
| Date |
Closing |
Open |
Range |
Volume |
Thu 04 December 2025 |
56.33 (-3.26%) |
58.06 |
56.22 - 58.42 |
0.5964 times |
Wed 03 December 2025 |
58.23 (-1.66%) |
59.38 |
57.93 - 59.93 |
0.9529 times |
Tue 02 December 2025 |
59.21 (0.8%) |
59.22 |
58.39 - 59.53 |
0.6114 times |
Mon 01 December 2025 |
58.74 (0.29%) |
58.27 |
58.02 - 59.00 |
0.9945 times |
Fri 28 November 2025 |
58.57 (-0.44%) |
58.79 |
58.47 - 59.23 |
0.4002 times |
Wed 26 November 2025 |
58.83 (1.47%) |
57.61 |
57.61 - 59.05 |
1.0888 times |
Tue 25 November 2025 |
57.98 (4.66%) |
55.91 |
55.62 - 58.44 |
1.6565 times |
Mon 24 November 2025 |
55.40 (-0.7%) |
55.55 |
54.84 - 56.04 |
1.5189 times |
Fri 21 November 2025 |
55.79 (2.69%) |
54.88 |
54.40 - 56.50 |
1.2551 times |
Thu 20 November 2025 |
54.33 (-0.69%) |
55.55 |
54.07 - 56.07 |
0.9251 times |
Wed 19 November 2025 |
54.71 (-1.03%) |
55.25 |
54.69 - 55.89 |
1.2306 times |
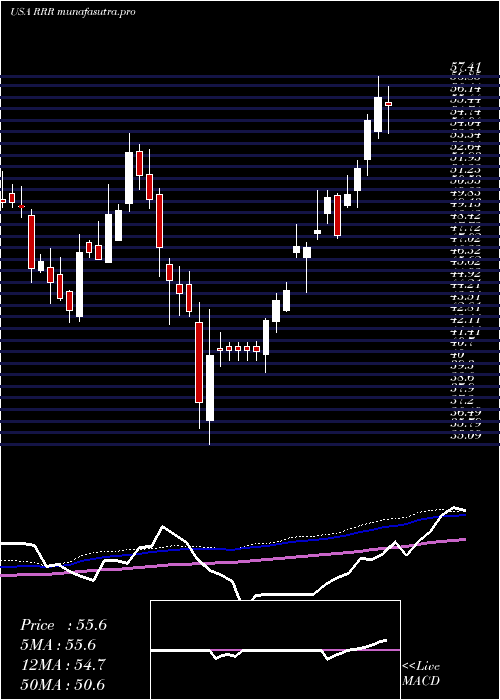
Weekly price and charts RedRock Strong weekly Stock price targets for RedRock RRR are 54.42 and 58.13 | Weekly Target 1 | 53.78 | | Weekly Target 2 | 55.06 | | Weekly Target 3 | 57.493333333333 | | Weekly Target 4 | 58.77 | | Weekly Target 5 | 61.2 |
Weekly price and volumes for Red Rock
| Date |
Closing |
Open |
Range |
Volume |
Thu 04 December 2025 |
56.33 (-3.82%) |
58.27 |
56.22 - 59.93 |
0.5242 times |
Fri 28 November 2025 |
58.57 (4.98%) |
55.55 |
54.84 - 59.23 |
0.7749 times |
Fri 21 November 2025 |
55.79 (-2.74%) |
56.97 |
53.03 - 57.16 |
1.1407 times |
Fri 14 November 2025 |
57.36 (-0.81%) |
58.37 |
56.90 - 60.15 |
3.1899 times |
Fri 07 November 2025 |
57.83 (8.48%) |
54.17 |
53.35 - 58.21 |
0.9754 times |
Fri 31 October 2025 |
53.31 (0%) |
53.27 |
52.49 - 53.90 |
0.2179 times |
Fri 31 October 2025 |
53.31 (-9.75%) |
58.93 |
51.76 - 59.49 |
1.1217 times |
Fri 24 October 2025 |
59.07 (0.68%) |
59.28 |
58.77 - 62.00 |
0.7649 times |
Fri 17 October 2025 |
58.67 (5.28%) |
55.45 |
55.26 - 59.19 |
0.6435 times |
Fri 10 October 2025 |
55.73 (-7.73%) |
60.37 |
55.52 - 60.94 |
0.6469 times |
Fri 03 October 2025 |
60.40 (-2.15%) |
62.51 |
59.96 - 62.81 |
0.6535 times |
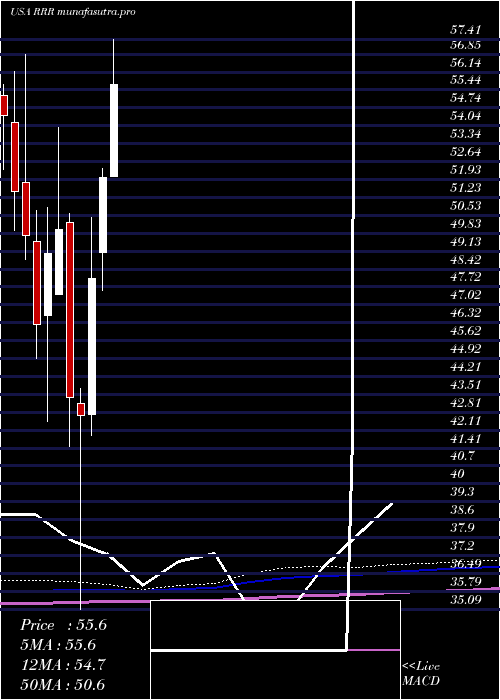
Monthly price and charts RedRock Strong monthly Stock price targets for RedRock RRR are 54.42 and 58.13 | Monthly Target 1 | 53.78 | | Monthly Target 2 | 55.06 | | Monthly Target 3 | 57.493333333333 | | Monthly Target 4 | 58.77 | | Monthly Target 5 | 61.2 |
Monthly price and volumes Red Rock
| Date |
Closing |
Open |
Range |
Volume |
Thu 04 December 2025 |
56.33 (-3.82%) |
58.27 |
56.22 - 59.93 |
0.1489 times |
Fri 28 November 2025 |
58.57 (9.87%) |
54.17 |
53.03 - 60.15 |
1.7269 times |
Fri 31 October 2025 |
53.31 (-12.69%) |
60.54 |
51.76 - 62.00 |
1.0699 times |
Tue 30 September 2025 |
61.06 (-1.31%) |
60.93 |
58.84 - 62.94 |
0.8815 times |
Fri 29 August 2025 |
61.87 (0.85%) |
60.31 |
55.73 - 63.60 |
1.1507 times |
Thu 31 July 2025 |
61.35 (17.91%) |
52.04 |
52.04 - 62.00 |
1.3435 times |
Mon 30 June 2025 |
52.03 (8.24%) |
49.07 |
47.57 - 52.36 |
0.8001 times |
Fri 30 May 2025 |
48.07 (12.58%) |
42.73 |
41.90 - 50.46 |
1.1133 times |
Wed 30 April 2025 |
42.70 (-1.54%) |
43.14 |
35.09 - 43.73 |
1.0219 times |
Mon 31 March 2025 |
43.37 (-13.21%) |
50.23 |
41.46 - 50.60 |
0.7432 times |
Fri 28 February 2025 |
49.97 (1.88%) |
47.44 |
47.43 - 53.97 |
0.8214 times |
DMA SMA EMA moving averages of Red Rock RRR
DMA (daily moving average) of Red Rock RRR
| DMA period | DMA value | | 5 day DMA | 58.22 | | 12 day DMA | 56.95 | | 20 day DMA | 57.14 | | 35 day DMA | 57.13 | | 50 day DMA | 57.74 | | 100 day DMA | 58.58 | | 150 day DMA | 55.54 | | 200 day DMA | 52.68 | EMA (exponential moving average) of Red Rock RRR
| EMA period | EMA current | EMA prev | EMA prev2 | | 5 day EMA | 57.67 | 58.34 | 58.39 | | 12 day EMA | 57.4 | 57.6 | 57.49 | | 20 day EMA | 57.26 | 57.36 | 57.27 | | 35 day EMA | 57.65 | 57.73 | 57.7 | | 50 day EMA | 58.04 | 58.11 | 58.11 |
SMA (simple moving average) of Red Rock RRR
| SMA period | SMA current | SMA prev | SMA prev2 | | 5 day SMA | 58.22 | 58.72 | 58.67 | | 12 day SMA | 56.95 | 56.76 | 56.68 | | 20 day SMA | 57.14 | 57.04 | 56.83 | | 35 day SMA | 57.13 | 57.19 | 57.17 | | 50 day SMA | 57.74 | 57.84 | 57.9 | | 100 day SMA | 58.58 | 58.57 | 58.55 | | 150 day SMA | 55.54 | 55.45 | 55.35 | | 200 day SMA | 52.68 | 52.67 | 52.64 |
|
|
