RedRobin RRGB full analysis,charts,indicators,moving averages,SMA,DMA,EMA,ADX,MACD,RSIRed Robin RRGB WideScreen charts, DMA,SMA,EMA technical analysis, forecast prediction, by indicators ADX,MACD,RSI,CCI USA stock exchange
operates under Consumer Services sector & deals in Restaurants
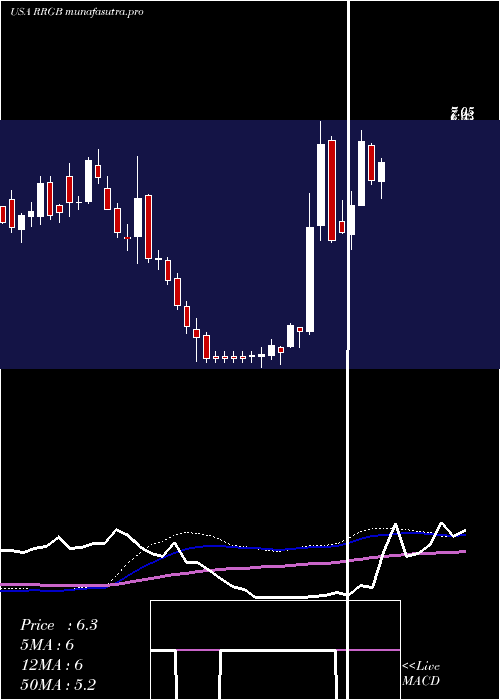
Daily price and charts and targets RedRobin Strong Daily Stock price targets for RedRobin RRGB are 4.05 and 4.14 | Daily Target 1 | 3.97 | | Daily Target 2 | 4.03 | | Daily Target 3 | 4.0633333333333 | | Daily Target 4 | 4.12 | | Daily Target 5 | 4.15 |
Daily price and volume Red Robin
| Date |
Closing |
Open |
Range |
Volume |
Thu 04 December 2025 |
4.08 (0.74%) |
4.06 |
4.01 - 4.10 |
0.4523 times |
Wed 03 December 2025 |
4.05 (0.75%) |
4.02 |
3.94 - 4.17 |
2.0713 times |
Tue 02 December 2025 |
4.02 (-4.74%) |
4.24 |
3.99 - 4.24 |
1.2669 times |
Mon 01 December 2025 |
4.22 (-3.65%) |
4.30 |
4.17 - 4.30 |
0.4069 times |
Fri 28 November 2025 |
4.38 (-0.45%) |
4.43 |
4.29 - 4.45 |
0.349 times |
Wed 26 November 2025 |
4.40 (6.02%) |
4.17 |
4.17 - 4.49 |
1.934 times |
Tue 25 November 2025 |
4.15 (6.96%) |
3.95 |
3.90 - 4.27 |
1.1954 times |
Mon 24 November 2025 |
3.88 (-2.02%) |
3.97 |
3.78 - 3.97 |
0.8307 times |
Fri 21 November 2025 |
3.96 (4.49%) |
3.80 |
3.80 - 4.05 |
0.7334 times |
Thu 20 November 2025 |
3.79 (-2.07%) |
3.93 |
3.77 - 4.06 |
0.7603 times |
Wed 19 November 2025 |
3.87 (-5.15%) |
4.08 |
3.85 - 4.12 |
0.614 times |
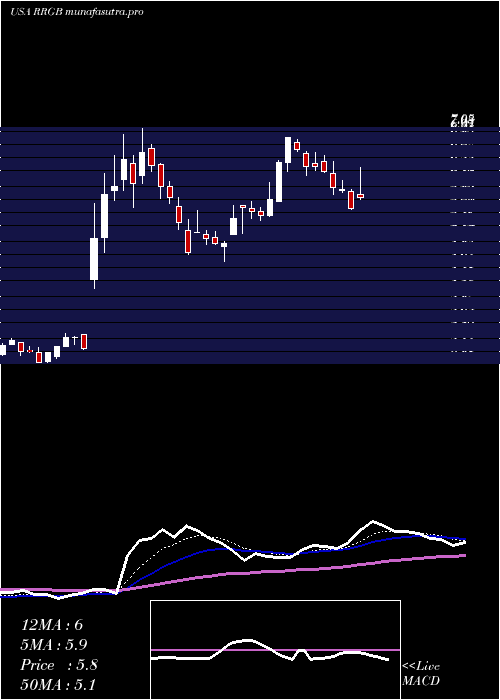
Weekly price and charts RedRobin Strong weekly Stock price targets for RedRobin RRGB are 3.83 and 4.19 | Weekly Target 1 | 3.75 | | Weekly Target 2 | 3.91 | | Weekly Target 3 | 4.1066666666667 | | Weekly Target 4 | 4.27 | | Weekly Target 5 | 4.47 |
Weekly price and volumes for Red Robin
| Date |
Closing |
Open |
Range |
Volume |
Thu 04 December 2025 |
4.08 (-6.85%) |
4.30 |
3.94 - 4.30 |
0.7906 times |
Fri 28 November 2025 |
4.38 (10.61%) |
3.97 |
3.78 - 4.49 |
0.8116 times |
Fri 21 November 2025 |
3.96 (-5.49%) |
4.15 |
3.77 - 4.20 |
0.7069 times |
Fri 14 November 2025 |
4.19 (-10.66%) |
4.75 |
4.10 - 4.88 |
2.1222 times |
Fri 07 November 2025 |
4.69 (-7.31%) |
4.75 |
4.60 - 5.34 |
1.3088 times |
Fri 31 October 2025 |
5.06 (0%) |
5.21 |
5.02 - 5.23 |
0.2149 times |
Fri 31 October 2025 |
5.06 (-20.69%) |
6.42 |
5.02 - 6.58 |
1.322 times |
Fri 24 October 2025 |
6.38 (-2.3%) |
6.54 |
6.36 - 6.66 |
0.6828 times |
Fri 17 October 2025 |
6.53 (3.32%) |
6.50 |
6.44 - 6.99 |
0.8001 times |
Fri 10 October 2025 |
6.32 (-11.24%) |
7.24 |
6.31 - 7.24 |
1.2401 times |
Fri 03 October 2025 |
7.12 (2.01%) |
7.01 |
6.77 - 7.52 |
1.0656 times |
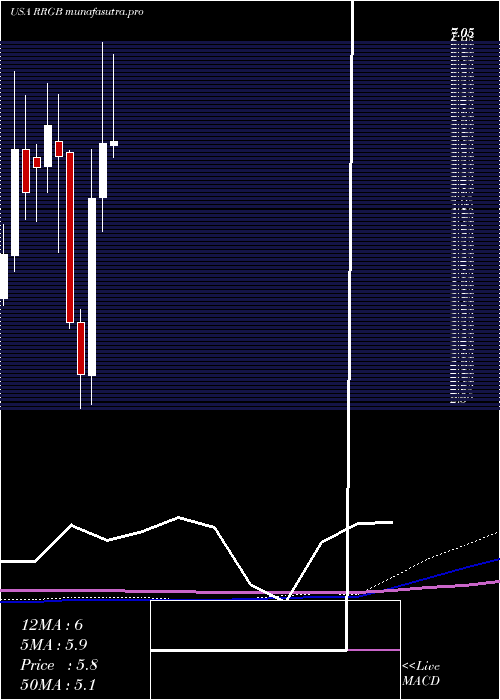
Monthly price and charts RedRobin Strong monthly Stock price targets for RedRobin RRGB are 3.83 and 4.19 | Monthly Target 1 | 3.75 | | Monthly Target 2 | 3.91 | | Monthly Target 3 | 4.1066666666667 | | Monthly Target 4 | 4.27 | | Monthly Target 5 | 4.47 |
Monthly price and volumes Red Robin
| Date |
Closing |
Open |
Range |
Volume |
Thu 04 December 2025 |
4.08 (-6.85%) |
4.30 |
3.94 - 4.30 |
0.088 times |
Fri 28 November 2025 |
4.38 (-13.44%) |
4.75 |
3.77 - 5.34 |
0.5512 times |
Fri 31 October 2025 |
5.06 (-26.24%) |
6.86 |
5.02 - 7.52 |
0.5607 times |
Tue 30 September 2025 |
6.86 (5.86%) |
6.37 |
5.98 - 7.20 |
0.4904 times |
Fri 29 August 2025 |
6.48 (11.53%) |
5.69 |
5.40 - 7.44 |
0.7643 times |
Thu 31 July 2025 |
5.81 (0.35%) |
5.76 |
5.62 - 7.89 |
0.7197 times |
Mon 30 June 2025 |
5.79 (13.53%) |
5.12 |
4.69 - 7.05 |
1.7064 times |
Fri 30 May 2025 |
5.10 (74.66%) |
2.91 |
2.55 - 5.71 |
3.9467 times |
Wed 30 April 2025 |
2.92 (-17.98%) |
3.56 |
2.50 - 3.72 |
0.6348 times |
Mon 31 March 2025 |
3.56 (-36.77%) |
5.68 |
3.49 - 5.70 |
0.5378 times |
Fri 28 February 2025 |
5.63 (-6.32%) |
5.81 |
4.43 - 6.40 |
1.0465 times |
DMA SMA EMA moving averages of Red Robin RRGB
DMA (daily moving average) of Red Robin RRGB
| DMA period | DMA value | | 5 day DMA | 4.15 | | 12 day DMA | 4.07 | | 20 day DMA | 4.22 | | 35 day DMA | 4.91 | | 50 day DMA | 5.5 | | 100 day DMA | 5.95 | | 150 day DMA | 5.54 | | 200 day DMA | 5.09 | EMA (exponential moving average) of Red Robin RRGB
| EMA period | EMA current | EMA prev | EMA prev2 | | 5 day EMA | 4.11 | 4.12 | 4.16 | | 12 day EMA | 4.17 | 4.19 | 4.22 | | 20 day EMA | 4.38 | 4.41 | 4.45 | | 35 day EMA | 4.89 | 4.94 | 4.99 | | 50 day EMA | 5.48 | 5.54 | 5.6 |
SMA (simple moving average) of Red Robin RRGB
| SMA period | SMA current | SMA prev | SMA prev2 | | 5 day SMA | 4.15 | 4.21 | 4.23 | | 12 day SMA | 4.07 | 4.07 | 4.08 | | 20 day SMA | 4.22 | 4.25 | 4.28 | | 35 day SMA | 4.91 | 4.99 | 5.07 | | 50 day SMA | 5.5 | 5.56 | 5.62 | | 100 day SMA | 5.95 | 5.97 | 5.98 | | 150 day SMA | 5.54 | 5.53 | 5.52 | | 200 day SMA | 5.09 | 5.09 | 5.09 |
|
|
