CohenSteers RQI full analysis,charts,indicators,moving averages,SMA,DMA,EMA,ADX,MACD,RSICohen Steers RQI WideScreen charts, DMA,SMA,EMA technical analysis, forecast prediction, by indicators ADX,MACD,RSI,CCI USA stock exchange
operates under N A sector & deals in N A
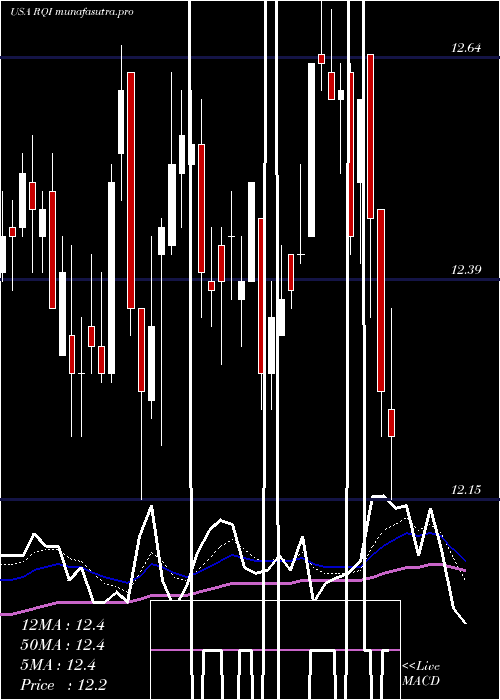
Daily price and charts and targets CohenSteers Strong Daily Stock price targets for CohenSteers RQI are 11.64 and 11.8 | Daily Target 1 | 11.6 | | Daily Target 2 | 11.67 | | Daily Target 3 | 11.763333333333 | | Daily Target 4 | 11.83 | | Daily Target 5 | 11.92 |
Daily price and volume Cohen Steers
| Date |
Closing |
Open |
Range |
Volume |
Thu 04 December 2025 |
11.73 (-0.42%) |
11.80 |
11.70 - 11.86 |
1.3893 times |
Wed 03 December 2025 |
11.78 (-0.17%) |
11.82 |
11.78 - 11.90 |
0.8306 times |
Tue 02 December 2025 |
11.80 (-0.51%) |
11.94 |
11.78 - 11.94 |
1.0691 times |
Mon 01 December 2025 |
11.86 (-1.25%) |
12.00 |
11.85 - 12.00 |
1.1402 times |
Fri 28 November 2025 |
12.01 (0.59%) |
12.03 |
11.93 - 12.04 |
0.6986 times |
Wed 26 November 2025 |
11.94 (1.44%) |
11.50 |
11.50 - 11.98 |
0.7378 times |
Tue 25 November 2025 |
11.77 (0.6%) |
11.74 |
11.71 - 11.85 |
0.8617 times |
Mon 24 November 2025 |
11.70 (1.12%) |
11.67 |
11.57 - 11.70 |
1.0963 times |
Fri 21 November 2025 |
11.57 (1.14%) |
11.45 |
11.45 - 11.62 |
1.2457 times |
Thu 20 November 2025 |
11.44 (-0.52%) |
11.56 |
11.43 - 11.66 |
0.9306 times |
Wed 19 November 2025 |
11.50 (-1.37%) |
11.73 |
11.49 - 11.74 |
1.0206 times |
Weekly price and charts CohenSteers Strong weekly Stock price targets for CohenSteers RQI are 11.57 and 11.87 | Weekly Target 1 | 11.51 | | Weekly Target 2 | 11.62 | | Weekly Target 3 | 11.81 | | Weekly Target 4 | 11.92 | | Weekly Target 5 | 12.11 |
Weekly price and volumes for Cohen Steers
| Date |
Closing |
Open |
Range |
Volume |
Thu 04 December 2025 |
11.73 (-2.33%) |
12.00 |
11.70 - 12.00 |
1.395 times |
Fri 28 November 2025 |
12.01 (3.8%) |
11.67 |
11.50 - 12.04 |
1.0691 times |
Fri 21 November 2025 |
11.57 (-2.03%) |
11.87 |
11.43 - 11.88 |
1.7177 times |
Fri 14 November 2025 |
11.81 (-1.5%) |
12.01 |
11.76 - 12.22 |
1.2109 times |
Fri 07 November 2025 |
11.99 (-0.83%) |
11.91 |
11.86 - 12.04 |
0.857 times |
Fri 31 October 2025 |
12.09 (0%) |
12.09 |
11.93 - 12.12 |
0.2369 times |
Fri 31 October 2025 |
12.09 (-2.66%) |
12.45 |
11.90 - 12.50 |
1.348 times |
Fri 24 October 2025 |
12.42 (1.06%) |
12.35 |
12.29 - 12.49 |
0.7843 times |
Fri 17 October 2025 |
12.29 (-0.97%) |
12.08 |
12.02 - 12.43 |
0.9089 times |
Tue 07 October 2025 |
12.41 (-0.32%) |
12.47 |
12.33 - 12.49 |
0.4721 times |
Fri 03 October 2025 |
12.45 (0.48%) |
12.43 |
12.33 - 12.61 |
1.0208 times |

Monthly price and charts CohenSteers Strong monthly Stock price targets for CohenSteers RQI are 11.57 and 11.87 | Monthly Target 1 | 11.51 | | Monthly Target 2 | 11.62 | | Monthly Target 3 | 11.81 | | Monthly Target 4 | 11.92 | | Monthly Target 5 | 12.11 |
Monthly price and volumes Cohen Steers
| Date |
Closing |
Open |
Range |
Volume |
Thu 04 December 2025 |
11.73 (-2.33%) |
12.00 |
11.70 - 12.00 |
0.3129 times |
Fri 28 November 2025 |
12.01 (-0.66%) |
11.91 |
11.43 - 12.22 |
1.089 times |
Fri 31 October 2025 |
12.09 (-3.05%) |
12.42 |
11.90 - 12.61 |
0.9693 times |
Tue 30 September 2025 |
12.47 (-0.56%) |
12.48 |
12.28 - 12.74 |
1.2386 times |
Fri 29 August 2025 |
12.54 (2.2%) |
12.25 |
12.01 - 12.62 |
1.0728 times |
Thu 31 July 2025 |
12.27 (-1.45%) |
12.43 |
12.22 - 12.71 |
1.0082 times |
Mon 30 June 2025 |
12.45 (0%) |
12.40 |
12.15 - 12.65 |
0.8348 times |
Fri 30 May 2025 |
12.45 (1.97%) |
12.36 |
11.94 - 12.57 |
0.9012 times |
Wed 30 April 2025 |
12.21 (-2.79%) |
12.63 |
10.39 - 12.79 |
1.5466 times |
Mon 31 March 2025 |
12.56 (-5.28%) |
13.29 |
12.21 - 13.46 |
1.0265 times |
Fri 28 February 2025 |
13.26 (3.67%) |
12.61 |
12.53 - 13.35 |
0.9452 times |

DMA SMA EMA moving averages of Cohen Steers RQI
DMA (daily moving average) of Cohen Steers RQI
| DMA period | DMA value | | 5 day DMA | 11.84 | | 12 day DMA | 11.73 | | 20 day DMA | 11.81 | | 35 day DMA | 11.99 | | 50 day DMA | 12.1 | | 100 day DMA | 12.26 | | 150 day DMA | 12.3 | | 200 day DMA | 12.31 | EMA (exponential moving average) of Cohen Steers RQI
| EMA period | EMA current | EMA prev | EMA prev2 | | 5 day EMA | 11.78 | 11.81 | 11.83 | | 12 day EMA | 11.81 | 11.82 | 11.83 | | 20 day EMA | 11.84 | 11.85 | 11.86 | | 35 day EMA | 11.97 | 11.98 | 11.99 | | 50 day EMA | 12.11 | 12.13 | 12.14 |
SMA (simple moving average) of Cohen Steers RQI
| SMA period | SMA current | SMA prev | SMA prev2 | | 5 day SMA | 11.84 | 11.88 | 11.88 | | 12 day SMA | 11.73 | 11.72 | 11.73 | | 20 day SMA | 11.81 | 11.82 | 11.83 | | 35 day SMA | 11.99 | 12 | 12.01 | | 50 day SMA | 12.1 | 12.12 | 12.13 | | 100 day SMA | 12.26 | 12.27 | 12.28 | | 150 day SMA | 12.3 | 12.3 | 12.3 | | 200 day SMA | 12.31 | 12.31 | 12.32 |
|
|
