RptRealty RPT full analysis,charts,indicators,moving averages,SMA,DMA,EMA,ADX,MACD,RSIRpt Realty RPT WideScreen charts, DMA,SMA,EMA technical analysis, forecast prediction, by indicators ADX,MACD,RSI,CCI USA stock exchange
operates under Consumer Services sector & deals in Real Estate Investment Trusts
Daily price and charts and targets RptRealty Strong Daily Stock price targets for RptRealty RPT are 2.47 and 2.54 | Daily Target 1 | 2.41 | | Daily Target 2 | 2.45 | | Daily Target 3 | 2.4766666666667 | | Daily Target 4 | 2.52 | | Daily Target 5 | 2.55 |
Daily price and volume Rpt Realty
| Date |
Closing |
Open |
Range |
Volume |
Mon 20 October 2025 |
2.50 (2.88%) |
2.49 |
2.43 - 2.50 |
0.8897 times |
Fri 17 October 2025 |
2.43 (1.25%) |
2.40 |
2.38 - 2.45 |
0.6739 times |
Thu 16 October 2025 |
2.40 (-1.23%) |
2.41 |
2.38 - 2.43 |
1.2777 times |
Wed 15 October 2025 |
2.43 (-0.82%) |
2.48 |
2.42 - 2.49 |
0.6322 times |
Tue 14 October 2025 |
2.45 (0.82%) |
2.43 |
2.40 - 2.45 |
0.573 times |
Mon 13 October 2025 |
2.43 (1.67%) |
2.40 |
2.38 - 2.43 |
1.129 times |
Fri 10 October 2025 |
2.39 (-3.24%) |
2.45 |
2.39 - 2.52 |
1.0716 times |
Thu 09 October 2025 |
2.47 (0%) |
2.42 |
2.42 - 2.50 |
0.8885 times |
Wed 08 October 2025 |
2.47 (1.65%) |
2.43 |
2.40 - 2.49 |
0.7084 times |
Tue 07 October 2025 |
2.43 (-2.41%) |
2.48 |
2.41 - 2.48 |
2.1559 times |
Mon 06 October 2025 |
2.49 (-0.4%) |
2.49 |
2.45 - 2.54 |
1.466 times |
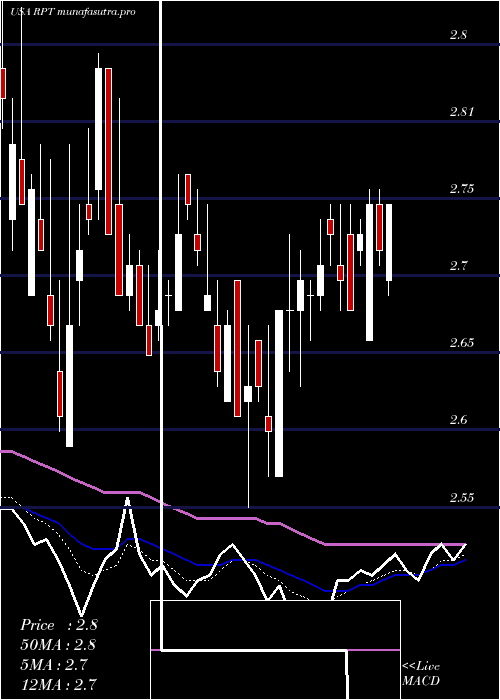
Weekly price and charts RptRealty Strong weekly Stock price targets for RptRealty RPT are 2.47 and 2.54 | Weekly Target 1 | 2.41 | | Weekly Target 2 | 2.45 | | Weekly Target 3 | 2.4766666666667 | | Weekly Target 4 | 2.52 | | Weekly Target 5 | 2.55 |
Weekly price and volumes for Rpt Realty
| Date |
Closing |
Open |
Range |
Volume |
Mon 20 October 2025 |
2.50 (2.88%) |
2.49 |
2.43 - 2.50 |
0.1559 times |
Fri 17 October 2025 |
2.43 (1.67%) |
2.40 |
2.38 - 2.49 |
0.7509 times |
Fri 10 October 2025 |
2.39 (-4.4%) |
2.49 |
2.39 - 2.54 |
1.1021 times |
Fri 03 October 2025 |
2.50 (-2.72%) |
2.56 |
2.49 - 2.61 |
0.555 times |
Fri 26 September 2025 |
2.57 (-3.38%) |
2.65 |
2.51 - 2.66 |
0.8407 times |
Fri 19 September 2025 |
2.66 (-2.21%) |
2.71 |
2.58 - 2.72 |
1.1175 times |
Fri 12 September 2025 |
2.72 (2.26%) |
2.69 |
2.62 - 2.81 |
0.8356 times |
Fri 05 September 2025 |
2.66 (3.5%) |
2.55 |
2.55 - 2.67 |
1.1571 times |
Fri 29 August 2025 |
2.57 (0%) |
2.60 |
2.56 - 2.62 |
1.4255 times |
Fri 29 August 2025 |
2.57 (-1.15%) |
2.58 |
2.56 - 2.62 |
2.0597 times |
Fri 22 August 2025 |
2.60 (0%) |
2.58 |
2.50 - 2.61 |
1.1608 times |
Monthly price and charts RptRealty Strong monthly Stock price targets for RptRealty RPT are 2.33 and 2.56 | Monthly Target 1 | 2.27 | | Monthly Target 2 | 2.38 | | Monthly Target 3 | 2.4966666666667 | | Monthly Target 4 | 2.61 | | Monthly Target 5 | 2.73 |
Monthly price and volumes Rpt Realty
| Date |
Closing |
Open |
Range |
Volume |
Mon 20 October 2025 |
2.50 (-0.79%) |
2.53 |
2.38 - 2.61 |
0.4726 times |
Tue 30 September 2025 |
2.52 (-1.95%) |
2.55 |
2.51 - 2.81 |
0.8843 times |
Fri 29 August 2025 |
2.57 (-1.15%) |
2.60 |
2.50 - 2.69 |
1.3163 times |
Thu 31 July 2025 |
2.60 (-3.7%) |
2.69 |
2.60 - 2.78 |
0.7769 times |
Mon 30 June 2025 |
2.70 (-1.1%) |
2.75 |
2.55 - 2.82 |
1.8079 times |
Fri 30 May 2025 |
2.73 (-6.51%) |
2.94 |
2.59 - 2.98 |
0.5159 times |
Wed 30 April 2025 |
2.92 (1.74%) |
2.86 |
2.29 - 3.02 |
1.2031 times |
Mon 31 March 2025 |
2.87 (-13.03%) |
3.31 |
2.80 - 3.42 |
1.0562 times |
Fri 28 February 2025 |
3.30 (7.14%) |
3.08 |
3.00 - 3.32 |
1.2433 times |
Fri 31 January 2025 |
3.08 (3.7%) |
2.99 |
2.65 - 3.15 |
0.7234 times |
Tue 31 December 2024 |
2.97 (-74.44%) |
11.57 |
2.75 - 13.79 |
23.7176 times |

DMA SMA EMA moving averages of Rpt Realty RPT
DMA (daily moving average) of Rpt Realty RPT
| DMA period | DMA value | | 5 day DMA | 2.44 | | 12 day DMA | 2.45 | | 20 day DMA | 2.49 | | 35 day DMA | 2.56 | | 50 day DMA | 2.57 | | 100 day DMA | 2.63 | | 150 day DMA | 2.67 | | 200 day DMA | 2.76 | EMA (exponential moving average) of Rpt Realty RPT
| EMA period | EMA current | EMA prev | EMA prev2 | | 5 day EMA | 2.45 | 2.43 | 2.43 | | 12 day EMA | 2.47 | 2.46 | 2.46 | | 20 day EMA | 2.48 | 2.48 | 2.49 | | 35 day EMA | 2.51 | 2.51 | 2.51 | | 50 day EMA | 2.55 | 2.55 | 2.56 |
SMA (simple moving average) of Rpt Realty RPT
| SMA period | SMA current | SMA prev | SMA prev2 | | 5 day SMA | 2.44 | 2.43 | 2.42 | | 12 day SMA | 2.45 | 2.45 | 2.46 | | 20 day SMA | 2.49 | 2.5 | 2.51 | | 35 day SMA | 2.56 | 2.56 | 2.57 | | 50 day SMA | 2.57 | 2.57 | 2.58 | | 100 day SMA | 2.63 | 2.63 | 2.63 | | 150 day SMA | 2.67 | 2.67 | 2.68 | | 200 day SMA | 2.76 | 2.76 | 2.76 |
|
|
