RossStores ROST full analysis,charts,indicators,moving averages,SMA,DMA,EMA,ADX,MACD,RSIRoss Stores ROST WideScreen charts, DMA,SMA,EMA technical analysis, forecast prediction, by indicators ADX,MACD,RSI,CCI USA stock exchange
operates under Consumer Services sector & deals in Clothing Shoe Accessory Stores
Daily price and charts and targets RossStores Strong Daily Stock price targets for RossStores ROST are 175.03 and 178.07 | Daily Target 1 | 174.34 | | Daily Target 2 | 175.72 | | Daily Target 3 | 177.38333333333 | | Daily Target 4 | 178.76 | | Daily Target 5 | 180.42 |
Daily price and volume Ross Stores
| Date |
Closing |
Open |
Range |
Volume |
Thu 04 December 2025 |
177.09 (-0.51%) |
178.67 |
176.01 - 179.05 |
0.8725 times |
Wed 03 December 2025 |
178.00 (0.24%) |
178.37 |
177.12 - 178.64 |
0.8733 times |
Tue 02 December 2025 |
177.57 (0.04%) |
177.72 |
176.08 - 178.53 |
1.0176 times |
Mon 01 December 2025 |
177.50 (0.65%) |
175.49 |
174.88 - 178.80 |
0.6203 times |
Fri 28 November 2025 |
176.36 (-0.75%) |
177.31 |
176.18 - 178.19 |
0.2502 times |
Wed 26 November 2025 |
177.69 (0.67%) |
176.23 |
175.47 - 178.09 |
0.5578 times |
Tue 25 November 2025 |
176.50 (1.36%) |
174.29 |
173.50 - 177.32 |
1.152 times |
Mon 24 November 2025 |
174.13 (0.07%) |
173.37 |
172.92 - 176.00 |
1.4234 times |
Fri 21 November 2025 |
174.00 (8.41%) |
166.73 |
163.51 - 174.86 |
1.9882 times |
Thu 20 November 2025 |
160.50 (0.03%) |
161.09 |
160.34 - 164.23 |
1.2447 times |
Wed 19 November 2025 |
160.45 (0.36%) |
160.50 |
158.87 - 161.86 |
0.624 times |
Weekly price and charts RossStores Strong weekly Stock price targets for RossStores ROST are 175.99 and 180.16 | Weekly Target 1 | 172.84 | | Weekly Target 2 | 174.96 | | Weekly Target 3 | 177.00666666667 | | Weekly Target 4 | 179.13 | | Weekly Target 5 | 181.18 |
Weekly price and volumes for Ross Stores
| Date |
Closing |
Open |
Range |
Volume |
Thu 04 December 2025 |
177.09 (0.41%) |
175.49 |
174.88 - 179.05 |
1.2531 times |
Fri 28 November 2025 |
176.36 (1.36%) |
173.37 |
172.92 - 178.19 |
1.2531 times |
Fri 21 November 2025 |
174.00 (8.36%) |
160.58 |
157.70 - 174.86 |
1.7824 times |
Fri 14 November 2025 |
160.58 (-0.31%) |
161.80 |
159.90 - 163.44 |
1.0268 times |
Fri 07 November 2025 |
161.08 (1.36%) |
160.19 |
158.85 - 165.07 |
0.7955 times |
Fri 31 October 2025 |
158.92 (0%) |
157.98 |
157.39 - 159.63 |
0.1653 times |
Fri 31 October 2025 |
158.92 (1.38%) |
159.47 |
157.39 - 161.95 |
0.9633 times |
Fri 24 October 2025 |
156.75 (0.28%) |
157.32 |
154.87 - 158.03 |
0.6965 times |
Fri 17 October 2025 |
156.31 (5.82%) |
148.97 |
148.58 - 157.91 |
1.1143 times |
Fri 10 October 2025 |
147.71 (-3.23%) |
152.24 |
147.49 - 153.46 |
0.9498 times |
Fri 03 October 2025 |
152.64 (0.74%) |
152.49 |
150.41 - 157.03 |
1.0098 times |
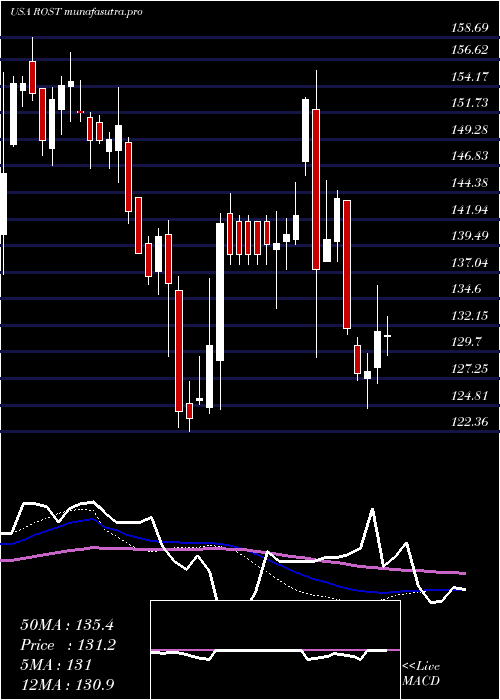
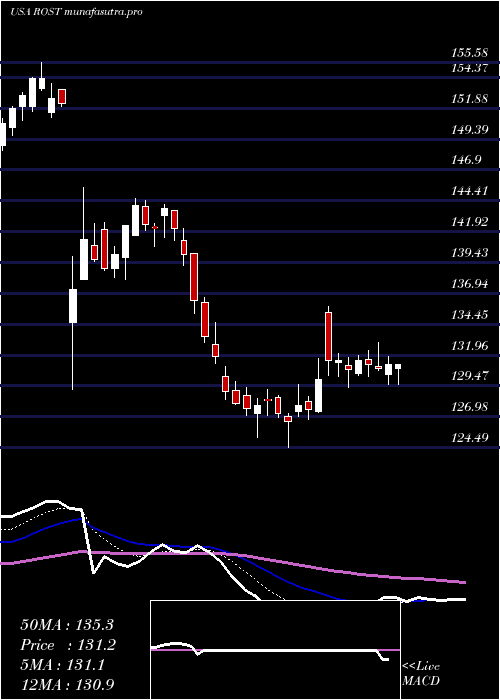
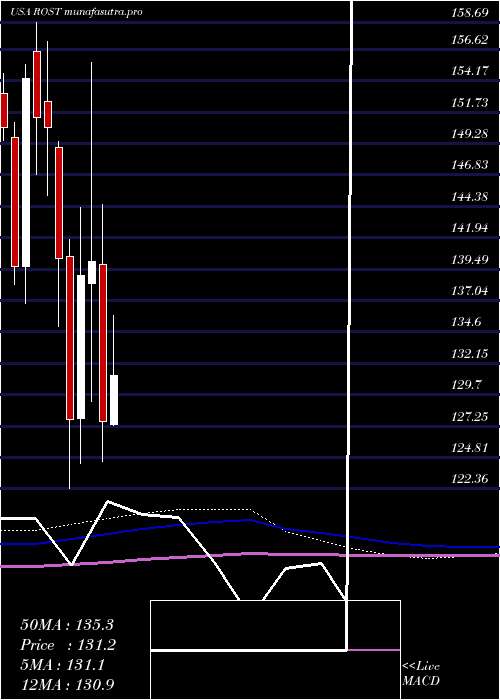
Monthly price and charts RossStores Strong monthly Stock price targets for RossStores ROST are 175.99 and 180.16 | Monthly Target 1 | 172.84 | | Monthly Target 2 | 174.96 | | Monthly Target 3 | 177.00666666667 | | Monthly Target 4 | 179.13 | | Monthly Target 5 | 181.18 |
Monthly price and volumes Ross Stores
| Date |
Closing |
Open |
Range |
Volume |
Thu 04 December 2025 |
177.09 (0.41%) |
175.49 |
174.88 - 179.05 |
0.2306 times |
Fri 28 November 2025 |
176.36 (10.97%) |
160.19 |
157.70 - 178.19 |
0.894 times |
Fri 31 October 2025 |
158.92 (4.29%) |
151.90 |
147.49 - 161.95 |
0.8258 times |
Tue 30 September 2025 |
152.39 (3.55%) |
146.37 |
143.39 - 153.54 |
0.9357 times |
Fri 29 August 2025 |
147.16 (7.78%) |
136.00 |
134.37 - 151.83 |
1.1981 times |
Thu 31 July 2025 |
136.54 (7.02%) |
127.41 |
126.32 - 141.39 |
0.9611 times |
Mon 30 June 2025 |
127.58 (-8.93%) |
139.87 |
124.49 - 144.55 |
1.1757 times |
Fri 30 May 2025 |
140.09 (0.78%) |
138.39 |
129.20 - 155.58 |
1.3042 times |
Wed 30 April 2025 |
139.00 (8.77%) |
127.88 |
124.36 - 144.31 |
1.1792 times |
Mon 31 March 2025 |
127.79 (-8.93%) |
140.50 |
122.36 - 141.80 |
1.2954 times |
Fri 28 February 2025 |
140.32 (-6.8%) |
148.97 |
135.03 - 149.44 |
0.7993 times |
DMA SMA EMA moving averages of Ross Stores ROST
DMA (daily moving average) of Ross Stores ROST
| DMA period | DMA value | | 5 day DMA | 177.3 | | 12 day DMA | 172.47 | | 20 day DMA | 168.02 | | 35 day DMA | 163.87 | | 50 day DMA | 160.44 | | 100 day DMA | 152.53 | | 150 day DMA | 147.77 | | 200 day DMA | 144.41 | EMA (exponential moving average) of Ross Stores ROST
| EMA period | EMA current | EMA prev | EMA prev2 | | 5 day EMA | 176.84 | 176.71 | 176.06 | | 12 day EMA | 173.29 | 172.6 | 171.62 | | 20 day EMA | 169.85 | 169.09 | 168.15 | | 35 day EMA | 165.12 | 164.41 | 163.61 | | 50 day EMA | 160.97 | 160.31 | 159.59 |
SMA (simple moving average) of Ross Stores ROST
| SMA period | SMA current | SMA prev | SMA prev2 | | 5 day SMA | 177.3 | 177.42 | 177.12 | | 12 day SMA | 172.47 | 171 | 169.55 | | 20 day SMA | 168.02 | 167.27 | 166.49 | | 35 day SMA | 163.87 | 163.29 | 162.64 | | 50 day SMA | 160.44 | 159.88 | 159.24 | | 100 day SMA | 152.53 | 152.03 | 151.56 | | 150 day SMA | 147.77 | 147.52 | 147.27 | | 200 day SMA | 144.41 | 144.22 | 144.02 |
|
|
