RoperTechnologies ROP full analysis,charts,indicators,moving averages,SMA,DMA,EMA,ADX,MACD,RSIRoper Technologies ROP WideScreen charts, DMA,SMA,EMA technical analysis, forecast prediction, by indicators ADX,MACD,RSI,CCI USA stock exchange
operates under Capital Goods sector & deals in Industrial Machinery Components
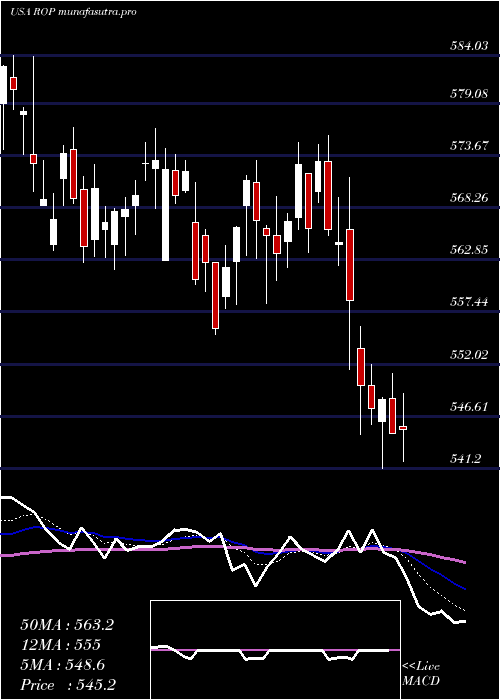
Daily price and charts and targets RoperTechnologies Strong Daily Stock price targets for RoperTechnologies ROP are 510.21 and 521.81 | Daily Target 1 | 501.04 | | Daily Target 2 | 507.78 | | Daily Target 3 | 512.64 | | Daily Target 4 | 519.38 | | Daily Target 5 | 524.24 |
Daily price and volume Roper Technologies
| Date |
Closing |
Open |
Range |
Volume |
Tue 21 October 2025 |
514.52 (1.71%) |
507.28 |
505.90 - 517.50 |
0.6805 times |
Mon 20 October 2025 |
505.89 (0.27%) |
504.51 |
501.52 - 506.96 |
0.97 times |
Fri 17 October 2025 |
504.52 (0.89%) |
500.04 |
498.42 - 505.04 |
0.7833 times |
Thu 16 October 2025 |
500.08 (0.07%) |
500.17 |
497.57 - 503.33 |
0.9152 times |
Wed 15 October 2025 |
499.73 (-2.74%) |
507.80 |
499.16 - 515.57 |
1.1562 times |
Tue 14 October 2025 |
513.82 (0.21%) |
508.40 |
506.79 - 515.32 |
0.7794 times |
Mon 13 October 2025 |
512.73 (0.73%) |
507.35 |
504.11 - 513.85 |
0.7997 times |
Fri 10 October 2025 |
509.00 (-1.75%) |
520.72 |
503.90 - 520.85 |
1.4116 times |
Thu 09 October 2025 |
518.07 (-0.37%) |
519.90 |
511.45 - 520.05 |
0.8495 times |
Wed 08 October 2025 |
520.00 (1.85%) |
512.13 |
509.45 - 521.28 |
1.6546 times |
Tue 07 October 2025 |
510.57 (0.71%) |
505.84 |
503.64 - 511.02 |
1.1147 times |
Weekly price and charts RoperTechnologies Strong weekly Stock price targets for RoperTechnologies ROP are 508.02 and 524 | Weekly Target 1 | 495.2 | | Weekly Target 2 | 504.86 | | Weekly Target 3 | 511.18 | | Weekly Target 4 | 520.84 | | Weekly Target 5 | 527.16 |
Weekly price and volumes for Roper Technologies
| Date |
Closing |
Open |
Range |
Volume |
Tue 21 October 2025 |
514.52 (1.98%) |
504.51 |
501.52 - 517.50 |
0.4096 times |
Fri 17 October 2025 |
504.52 (-0.88%) |
507.35 |
497.57 - 515.57 |
1.1002 times |
Fri 10 October 2025 |
509.00 (1.81%) |
501.90 |
497.12 - 521.28 |
1.5766 times |
Fri 03 October 2025 |
499.95 (0.13%) |
500.22 |
494.78 - 504.91 |
1.105 times |
Fri 26 September 2025 |
499.31 (-1.05%) |
501.50 |
492.25 - 510.46 |
1.0959 times |
Fri 19 September 2025 |
504.62 (-1.54%) |
512.53 |
499.00 - 517.44 |
1.5401 times |
Fri 12 September 2025 |
512.53 (-1.14%) |
519.10 |
509.13 - 524.90 |
1.2584 times |
Fri 05 September 2025 |
518.44 (-1.5%) |
524.09 |
516.25 - 530.00 |
0.6882 times |
Fri 29 August 2025 |
526.31 (0%) |
529.50 |
524.11 - 532.18 |
0.2366 times |
Fri 29 August 2025 |
526.31 (-1.96%) |
535.90 |
522.34 - 536.57 |
0.9894 times |
Fri 22 August 2025 |
536.84 (1.36%) |
529.99 |
526.66 - 544.94 |
1.2755 times |
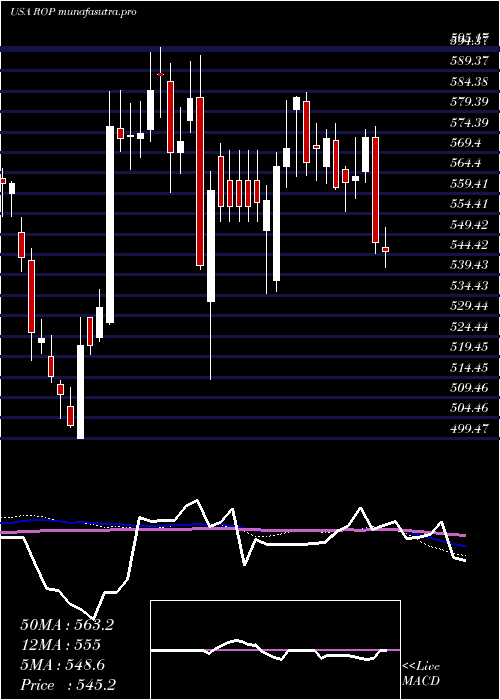
Monthly price and charts RoperTechnologies Strong monthly Stock price targets for RoperTechnologies ROP are 504.98 and 530.82 | Monthly Target 1 | 484.57 | | Monthly Target 2 | 499.55 | | Monthly Target 3 | 510.41333333333 | | Monthly Target 4 | 525.39 | | Monthly Target 5 | 536.25 |
Monthly price and volumes Roper Technologies
| Date |
Closing |
Open |
Range |
Volume |
Tue 21 October 2025 |
514.52 (3.17%) |
499.26 |
495.44 - 521.28 |
1.0239 times |
Tue 30 September 2025 |
498.69 (-5.25%) |
524.09 |
492.25 - 530.00 |
1.3558 times |
Fri 29 August 2025 |
526.31 (-4.38%) |
551.10 |
514.05 - 551.11 |
1.1557 times |
Thu 31 July 2025 |
550.40 (-2.9%) |
567.24 |
535.70 - 575.77 |
1.0375 times |
Mon 30 June 2025 |
566.84 (-0.6%) |
565.94 |
555.05 - 576.49 |
0.7138 times |
Fri 30 May 2025 |
570.27 (1.82%) |
564.14 |
556.53 - 584.03 |
0.8229 times |
Wed 30 April 2025 |
560.08 (-5%) |
585.80 |
513.87 - 593.00 |
1.0488 times |
Mon 31 March 2025 |
589.58 (0.87%) |
588.49 |
559.60 - 595.17 |
0.831 times |
Fri 28 February 2025 |
584.50 (1.54%) |
575.24 |
565.28 - 593.91 |
0.8581 times |
Fri 31 January 2025 |
575.65 (10.73%) |
524.70 |
499.47 - 584.31 |
1.1524 times |
Tue 31 December 2024 |
519.85 (-7.48%) |
549.83 |
513.91 - 553.46 |
0.6698 times |
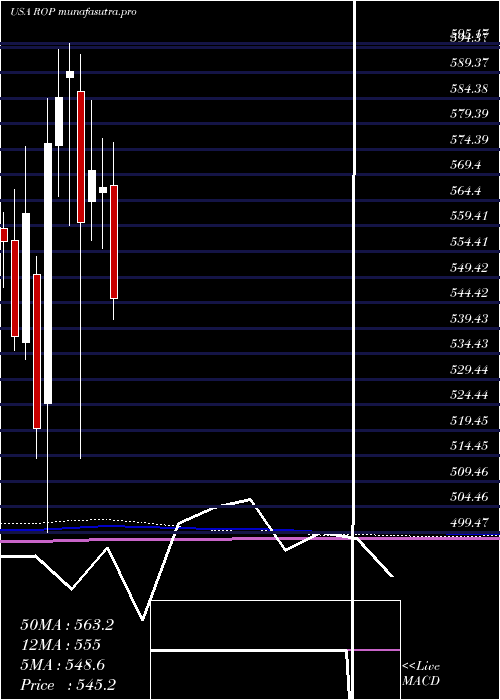
DMA SMA EMA moving averages of Roper Technologies ROP
DMA (daily moving average) of Roper Technologies ROP
| DMA period | DMA value | | 5 day DMA | 504.95 | | 12 day DMA | 509.66 | | 20 day DMA | 505.56 | | 35 day DMA | 508.9 | | 50 day DMA | 514.79 | | 100 day DMA | 536.35 | | 150 day DMA | 546.15 | | 200 day DMA | 548.96 | EMA (exponential moving average) of Roper Technologies ROP
| EMA period | EMA current | EMA prev | EMA prev2 | | 5 day EMA | 508.45 | 505.42 | 505.19 | | 12 day EMA | 507.74 | 506.51 | 506.62 | | 20 day EMA | 508.13 | 507.46 | 507.63 | | 35 day EMA | 511.62 | 511.45 | 511.78 | | 50 day EMA | 515.26 | 515.29 | 515.67 |
SMA (simple moving average) of Roper Technologies ROP
| SMA period | SMA current | SMA prev | SMA prev2 | | 5 day SMA | 504.95 | 504.81 | 506.18 | | 12 day SMA | 509.66 | 508.45 | 507.75 | | 20 day SMA | 505.56 | 505.03 | 505.22 | | 35 day SMA | 508.9 | 509.03 | 509.61 | | 50 day SMA | 514.79 | 514.89 | 515.32 | | 100 day SMA | 536.35 | 536.9 | 537.58 | | 150 day SMA | 546.15 | 546.56 | 546.98 | | 200 day SMA | 548.96 | 548.96 | 549 |
|
|
