RangerEnergy RNGR full analysis,charts,indicators,moving averages,SMA,DMA,EMA,ADX,MACD,RSIRanger Energy RNGR WideScreen charts, DMA,SMA,EMA technical analysis, forecast prediction, by indicators ADX,MACD,RSI,CCI USA stock exchange
operates under Energy sector & deals in Oilfield Services Equipment
Daily price and charts and targets RangerEnergy Strong Daily Stock price targets for RangerEnergy RNGR are 12.8 and 13.36 | Daily Target 1 | 12.33 | | Daily Target 2 | 12.7 | | Daily Target 3 | 12.89 | | Daily Target 4 | 13.26 | | Daily Target 5 | 13.45 |
Daily price and volume Ranger Energy
| Date |
Closing |
Open |
Range |
Volume |
Mon 20 October 2025 |
13.07 (5.4%) |
12.52 |
12.52 - 13.08 |
0.8551 times |
Fri 17 October 2025 |
12.40 (-3.8%) |
12.83 |
12.36 - 12.85 |
1.0476 times |
Thu 16 October 2025 |
12.89 (1.02%) |
12.81 |
12.61 - 13.01 |
1.5605 times |
Wed 15 October 2025 |
12.76 (-3.11%) |
12.90 |
12.58 - 13.11 |
1.2296 times |
Tue 07 October 2025 |
13.17 (-5.79%) |
13.84 |
12.98 - 14.02 |
1.2853 times |
Mon 06 October 2025 |
13.98 (0.14%) |
14.35 |
13.89 - 14.37 |
0.7855 times |
Fri 03 October 2025 |
13.96 (2.65%) |
13.74 |
13.72 - 14.08 |
0.7295 times |
Thu 02 October 2025 |
13.60 (-2.72%) |
13.85 |
13.58 - 14.07 |
0.8698 times |
Wed 01 October 2025 |
13.98 (-0.43%) |
13.88 |
13.86 - 14.21 |
0.7626 times |
Tue 30 September 2025 |
14.04 (-1.82%) |
14.14 |
13.84 - 14.21 |
0.8746 times |
Mon 29 September 2025 |
14.30 (-1.24%) |
14.40 |
13.99 - 14.53 |
1.5259 times |
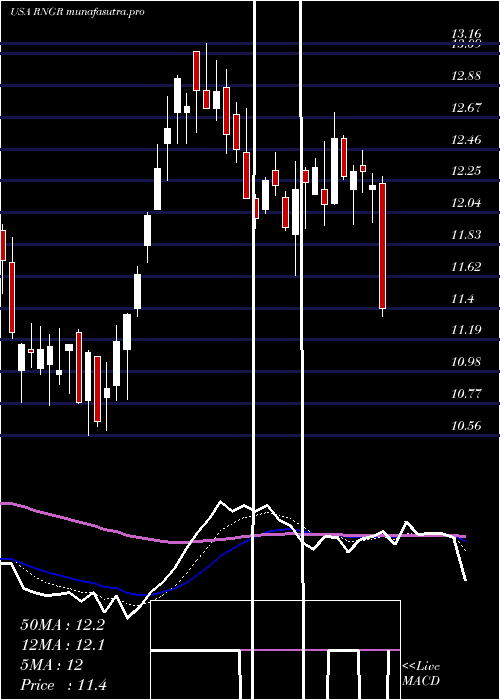
Weekly price and charts RangerEnergy Strong weekly Stock price targets for RangerEnergy RNGR are 12.8 and 13.36 | Weekly Target 1 | 12.33 | | Weekly Target 2 | 12.7 | | Weekly Target 3 | 12.89 | | Weekly Target 4 | 13.26 | | Weekly Target 5 | 13.45 |
Weekly price and volumes for Ranger Energy
| Date |
Closing |
Open |
Range |
Volume |
Mon 20 October 2025 |
13.07 (5.4%) |
12.52 |
12.52 - 13.08 |
0.1726 times |
Fri 17 October 2025 |
12.40 (-11.17%) |
14.35 |
12.36 - 14.37 |
1.1925 times |
Fri 03 October 2025 |
13.96 (-3.59%) |
14.40 |
13.58 - 14.53 |
0.9612 times |
Fri 26 September 2025 |
14.48 (5.54%) |
13.65 |
13.15 - 14.67 |
1.1662 times |
Fri 19 September 2025 |
13.72 (0.44%) |
14.23 |
13.72 - 14.76 |
2.5314 times |
Fri 12 September 2025 |
13.66 (-3.46%) |
14.28 |
13.44 - 14.30 |
0.656 times |
Fri 05 September 2025 |
14.15 (-0.84%) |
14.13 |
13.66 - 14.40 |
0.6615 times |
Fri 29 August 2025 |
14.27 (0%) |
14.23 |
14.11 - 14.33 |
0.1664 times |
Fri 29 August 2025 |
14.27 (5.24%) |
13.46 |
13.46 - 14.33 |
1.3631 times |
Fri 22 August 2025 |
13.56 (7.79%) |
12.58 |
12.54 - 13.72 |
1.129 times |
Fri 15 August 2025 |
12.58 (-0.16%) |
12.60 |
12.46 - 13.14 |
0.9666 times |
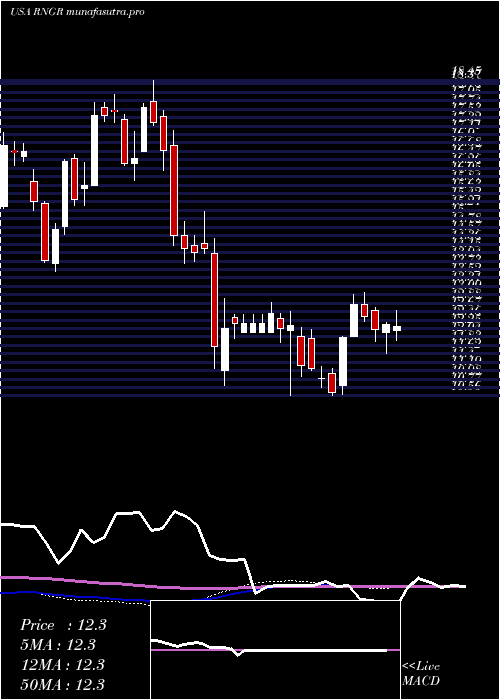
Monthly price and charts RangerEnergy Strong monthly Stock price targets for RangerEnergy RNGR are 11.71 and 13.72 | Monthly Target 1 | 11.26 | | Monthly Target 2 | 12.16 | | Monthly Target 3 | 13.266666666667 | | Monthly Target 4 | 14.17 | | Monthly Target 5 | 15.28 |
Monthly price and volumes Ranger Energy
| Date |
Closing |
Open |
Range |
Volume |
Mon 20 October 2025 |
13.07 (-6.91%) |
13.88 |
12.36 - 14.37 |
0.3993 times |
Tue 30 September 2025 |
14.04 (-1.61%) |
14.13 |
13.15 - 14.76 |
1.1923 times |
Fri 29 August 2025 |
14.27 (6.57%) |
13.15 |
12.37 - 14.33 |
1.0045 times |
Thu 31 July 2025 |
13.39 (12.14%) |
11.89 |
11.14 - 15.10 |
1.5077 times |
Mon 30 June 2025 |
11.94 (12.11%) |
10.81 |
10.59 - 13.16 |
1.836 times |
Fri 30 May 2025 |
10.65 (-3.97%) |
11.20 |
10.56 - 12.39 |
0.9862 times |
Wed 30 April 2025 |
11.09 (-21.85%) |
14.00 |
10.57 - 14.51 |
0.7733 times |
Mon 31 March 2025 |
14.19 (-15.08%) |
16.83 |
13.77 - 17.21 |
0.8145 times |
Fri 28 February 2025 |
16.71 (1.95%) |
16.39 |
15.96 - 18.45 |
0.5337 times |
Fri 31 January 2025 |
16.39 (5.88%) |
15.70 |
15.33 - 18.10 |
0.9525 times |
Tue 31 December 2024 |
15.48 (-7.14%) |
15.92 |
13.67 - 16.24 |
0.8221 times |
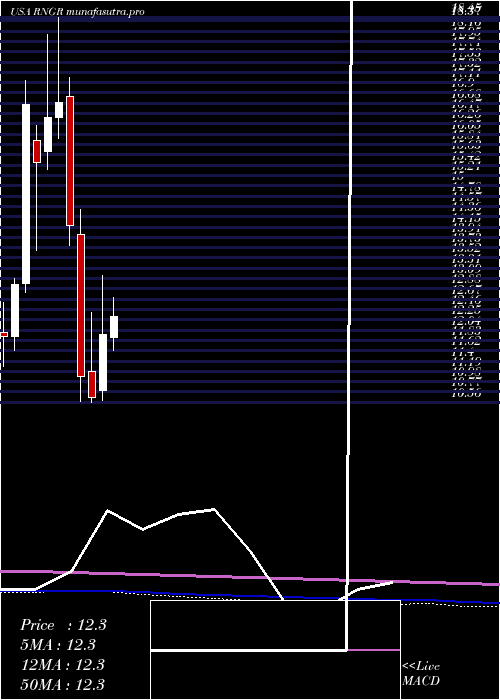
DMA SMA EMA moving averages of Ranger Energy RNGR
DMA (daily moving average) of Ranger Energy RNGR
| DMA period | DMA value | | 5 day DMA | 12.86 | | 12 day DMA | 13.55 | | 20 day DMA | 13.79 | | 35 day DMA | 13.87 | | 50 day DMA | 13.57 | | 100 day DMA | 12.83 | | 150 day DMA | 12.79 | | 200 day DMA | 13.76 | EMA (exponential moving average) of Ranger Energy RNGR
| EMA period | EMA current | EMA prev | EMA prev2 | | 5 day EMA | 12.99 | 12.95 | 13.22 | | 12 day EMA | 13.36 | 13.41 | 13.59 | | 20 day EMA | 13.54 | 13.59 | 13.72 | | 35 day EMA | 13.57 | 13.6 | 13.67 | | 50 day EMA | 13.5 | 13.52 | 13.57 |
SMA (simple moving average) of Ranger Energy RNGR
| SMA period | SMA current | SMA prev | SMA prev2 | | 5 day SMA | 12.86 | 13.04 | 13.35 | | 12 day SMA | 13.55 | 13.65 | 13.82 | | 20 day SMA | 13.79 | 13.85 | 13.91 | | 35 day SMA | 13.87 | 13.89 | 13.92 | | 50 day SMA | 13.57 | 13.57 | 13.59 | | 100 day SMA | 12.83 | 12.81 | 12.8 | | 150 day SMA | 12.79 | 12.8 | 12.82 | | 200 day SMA | 13.76 | 13.77 | 13.78 |
|
|
