RambusInc RMBS full analysis,charts,indicators,moving averages,SMA,DMA,EMA,ADX,MACD,RSIRambus Inc RMBS WideScreen charts, DMA,SMA,EMA technical analysis, forecast prediction, by indicators ADX,MACD,RSI,CCI USA stock exchange
operates under Technology sector & deals in Semiconductors
Daily price and charts and targets RambusInc Strong Daily Stock price targets for RambusInc RMBS are 97.69 and 100.98 | Daily Target 1 | 95.12 | | Daily Target 2 | 96.96 | | Daily Target 3 | 98.406666666667 | | Daily Target 4 | 100.25 | | Daily Target 5 | 101.7 |
Daily price and volume Rambus Inc
| Date |
Closing |
Open |
Range |
Volume |
Thu 04 December 2025 |
98.81 (0.8%) |
97.46 |
96.56 - 99.85 |
0.7032 times |
Wed 03 December 2025 |
98.03 (1.89%) |
95.88 |
93.72 - 98.51 |
0.9539 times |
Tue 02 December 2025 |
96.21 (2.14%) |
95.92 |
95.71 - 99.76 |
0.7892 times |
Mon 01 December 2025 |
94.19 (-1.44%) |
93.41 |
92.03 - 95.22 |
0.706 times |
Fri 28 November 2025 |
95.57 (0.74%) |
94.93 |
94.11 - 95.62 |
0.4812 times |
Wed 26 November 2025 |
94.87 (2.62%) |
93.74 |
92.11 - 96.25 |
0.888 times |
Tue 25 November 2025 |
92.45 (-0.21%) |
91.09 |
88.30 - 92.59 |
0.8341 times |
Mon 24 November 2025 |
92.64 (5.09%) |
90.04 |
89.00 - 93.62 |
0.5787 times |
Fri 21 November 2025 |
88.15 (1%) |
87.25 |
82.51 - 89.84 |
1.583 times |
Thu 20 November 2025 |
87.28 (-3.26%) |
95.02 |
85.56 - 96.00 |
2.4828 times |
Wed 19 November 2025 |
90.22 (2.87%) |
88.25 |
88.10 - 92.29 |
0.9508 times |
Weekly price and charts RambusInc Strong weekly Stock price targets for RambusInc RMBS are 95.42 and 103.24 | Weekly Target 1 | 89.08 | | Weekly Target 2 | 93.94 | | Weekly Target 3 | 96.896666666667 | | Weekly Target 4 | 101.76 | | Weekly Target 5 | 104.72 |
Weekly price and volumes for Rambus Inc
| Date |
Closing |
Open |
Range |
Volume |
Thu 04 December 2025 |
98.81 (3.39%) |
93.41 |
92.03 - 99.85 |
0.6038 times |
Fri 28 November 2025 |
95.57 (8.42%) |
90.04 |
88.30 - 96.25 |
0.5329 times |
Fri 21 November 2025 |
88.15 (-7.45%) |
94.04 |
82.51 - 96.00 |
1.3337 times |
Fri 14 November 2025 |
95.25 (-11.6%) |
111.24 |
87.62 - 114.37 |
0.9206 times |
Fri 07 November 2025 |
107.75 (4.77%) |
101.35 |
99.25 - 110.26 |
0.6252 times |
Fri 31 October 2025 |
102.84 (0%) |
110.00 |
101.66 - 110.55 |
0.2904 times |
Fri 31 October 2025 |
102.84 (-2.37%) |
109.35 |
95.25 - 114.55 |
2.4034 times |
Fri 24 October 2025 |
105.34 (9.43%) |
98.05 |
92.01 - 108.32 |
0.9322 times |
Fri 17 October 2025 |
96.26 (7.47%) |
95.60 |
92.88 - 101.00 |
1.0243 times |
Fri 10 October 2025 |
89.57 (-9.7%) |
100.77 |
89.35 - 104.12 |
1.3334 times |
Fri 03 October 2025 |
99.19 (-3.34%) |
106.04 |
97.88 - 107.00 |
1.1326 times |
Monthly price and charts RambusInc Strong monthly Stock price targets for RambusInc RMBS are 95.42 and 103.24 | Monthly Target 1 | 89.08 | | Monthly Target 2 | 93.94 | | Monthly Target 3 | 96.896666666667 | | Monthly Target 4 | 101.76 | | Monthly Target 5 | 104.72 |
Monthly price and volumes Rambus Inc
| Date |
Closing |
Open |
Range |
Volume |
Thu 04 December 2025 |
98.81 (3.39%) |
93.41 |
92.03 - 99.85 |
0.1651 times |
Fri 28 November 2025 |
95.57 (-7.07%) |
101.35 |
82.51 - 114.37 |
0.933 times |
Fri 31 October 2025 |
102.84 (-1.31%) |
101.99 |
89.35 - 114.55 |
1.8275 times |
Tue 30 September 2025 |
104.20 (41.25%) |
71.72 |
70.90 - 109.15 |
2.1031 times |
Fri 29 August 2025 |
73.77 (-0.22%) |
71.00 |
67.15 - 81.89 |
0.9941 times |
Thu 31 July 2025 |
73.93 (15.48%) |
63.39 |
61.16 - 76.07 |
1.0395 times |
Mon 30 June 2025 |
64.02 (19.73%) |
53.17 |
53.11 - 64.90 |
0.6426 times |
Fri 30 May 2025 |
53.47 (9.59%) |
50.05 |
48.80 - 58.20 |
0.7496 times |
Wed 30 April 2025 |
48.79 (-5.77%) |
51.35 |
40.12 - 53.82 |
0.9794 times |
Mon 31 March 2025 |
51.78 (-7.35%) |
56.44 |
50.01 - 59.80 |
0.5661 times |
Fri 28 February 2025 |
55.89 (-9.3%) |
59.32 |
52.62 - 69.15 |
0.8467 times |
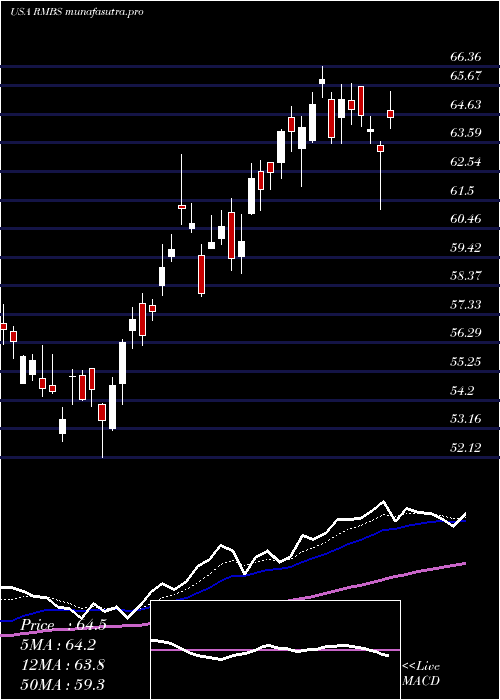
DMA SMA EMA moving averages of Rambus Inc RMBS
DMA (daily moving average) of Rambus Inc RMBS
| DMA period | DMA value | | 5 day DMA | 96.56 | | 12 day DMA | 93.01 | | 20 day DMA | 96.34 | | 35 day DMA | 99.07 | | 50 day DMA | 99.23 | | 100 day DMA | 88.36 | | 150 day DMA | 78.3 | | 200 day DMA | 71.57 | EMA (exponential moving average) of Rambus Inc RMBS
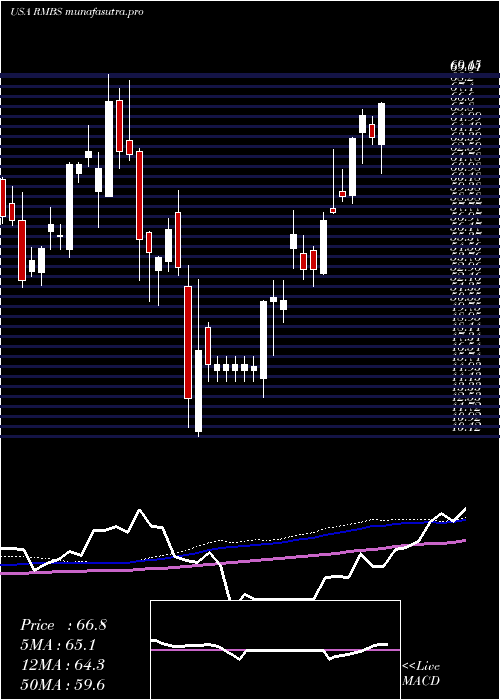
| EMA period | EMA current | EMA prev | EMA prev2 | | 5 day EMA | 96.76 | 95.73 | 94.58 | | 12 day EMA | 95.67 | 95.1 | 94.57 | | 20 day EMA | 96.38 | 96.12 | 95.92 | | 35 day EMA | 97.47 | 97.39 | 97.35 | | 50 day EMA | 99.37 | 99.39 | 99.45 |
SMA (simple moving average) of Rambus Inc RMBS
| SMA period | SMA current | SMA prev | SMA prev2 | | 5 day SMA | 96.56 | 95.77 | 94.66 | | 12 day SMA | 93.01 | 92.37 | 92.14 | | 20 day SMA | 96.34 | 96.83 | 96.94 | | 35 day SMA | 99.07 | 99.03 | 98.94 | | 50 day SMA | 99.23 | 99.27 | 99.36 | | 100 day SMA | 88.36 | 88.02 | 87.67 | | 150 day SMA | 78.3 | 77.96 | 77.64 | | 200 day SMA | 71.57 | 71.41 | 71.26 |
|
|
