ReMax RMAX full analysis,charts,indicators,moving averages,SMA,DMA,EMA,ADX,MACD,RSIRe Max RMAX WideScreen charts, DMA,SMA,EMA technical analysis, forecast prediction, by indicators ADX,MACD,RSI,CCI USA stock exchange
operates under Finance sector & deals in Real Estate
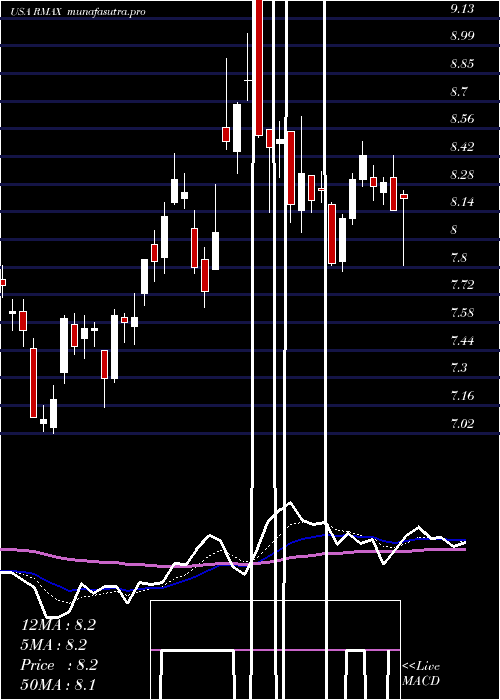
Daily price and charts and targets ReMax Strong Daily Stock price targets for ReMax RMAX are 8 and 8.16 | Daily Target 1 | 7.96 | | Daily Target 2 | 8.03 | | Daily Target 3 | 8.1233333333333 | | Daily Target 4 | 8.19 | | Daily Target 5 | 8.28 |
Daily price and volume Re Max
| Date |
Closing |
Open |
Range |
Volume |
Thu 04 December 2025 |
8.09 (-1.94%) |
8.22 |
8.06 - 8.22 |
0.6268 times |
Wed 03 December 2025 |
8.25 (0.86%) |
8.19 |
8.13 - 8.35 |
0.7481 times |
Tue 02 December 2025 |
8.18 (-0.61%) |
8.30 |
8.12 - 8.30 |
0.5829 times |
Mon 01 December 2025 |
8.23 (0.12%) |
8.11 |
8.09 - 8.30 |
1.2111 times |
Fri 28 November 2025 |
8.22 (-1.79%) |
8.36 |
8.20 - 8.36 |
0.4 times |
Wed 26 November 2025 |
8.37 (-0.24%) |
8.39 |
8.30 - 8.45 |
0.9534 times |
Tue 25 November 2025 |
8.39 (3.45%) |
8.14 |
8.14 - 8.44 |
1.3343 times |
Mon 24 November 2025 |
8.11 (3.05%) |
7.84 |
7.84 - 8.26 |
1.4838 times |
Fri 21 November 2025 |
7.87 (8.25%) |
7.32 |
7.32 - 7.90 |
1.5212 times |
Thu 20 November 2025 |
7.27 (-2.42%) |
7.49 |
7.25 - 7.61 |
1.1383 times |
Wed 19 November 2025 |
7.45 (-2.99%) |
7.73 |
7.43 - 7.73 |
0.6826 times |
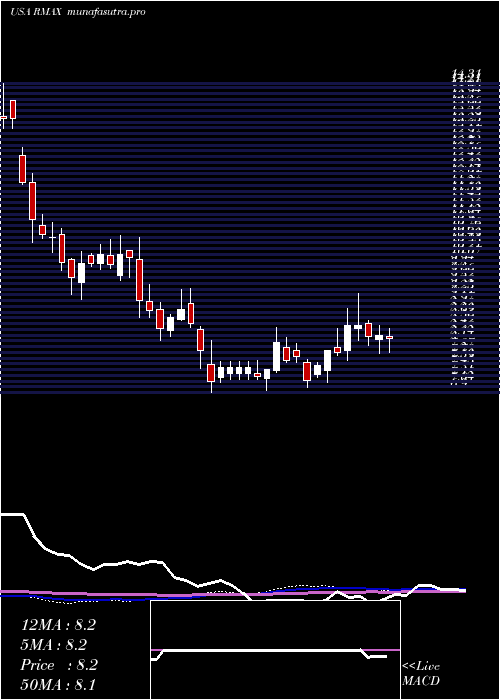
Weekly price and charts ReMax Strong weekly Stock price targets for ReMax RMAX are 7.93 and 8.22 | Weekly Target 1 | 7.88 | | Weekly Target 2 | 7.98 | | Weekly Target 3 | 8.1666666666667 | | Weekly Target 4 | 8.27 | | Weekly Target 5 | 8.46 |
Weekly price and volumes for Re Max
| Date |
Closing |
Open |
Range |
Volume |
Thu 04 December 2025 |
8.09 (-1.58%) |
8.11 |
8.06 - 8.35 |
0.683 times |
Fri 28 November 2025 |
8.22 (4.45%) |
7.84 |
7.84 - 8.45 |
0.899 times |
Fri 21 November 2025 |
7.87 (4.38%) |
7.52 |
7.25 - 7.90 |
1.2375 times |
Fri 14 November 2025 |
7.54 (0.13%) |
7.59 |
7.44 - 7.82 |
1.4479 times |
Fri 07 November 2025 |
7.53 (-5.04%) |
7.90 |
7.49 - 7.95 |
1.0991 times |
Fri 31 October 2025 |
7.93 (0%) |
8.05 |
7.54 - 8.11 |
0.4467 times |
Fri 31 October 2025 |
7.93 (-10.09%) |
8.86 |
7.54 - 8.87 |
1.1456 times |
Fri 24 October 2025 |
8.82 (7.56%) |
8.34 |
8.27 - 8.87 |
0.8496 times |
Fri 17 October 2025 |
8.20 (0.99%) |
8.25 |
8.07 - 8.56 |
0.9878 times |
Fri 10 October 2025 |
8.12 (-11.64%) |
9.24 |
8.09 - 9.24 |
1.2039 times |
Fri 03 October 2025 |
9.19 (-5.55%) |
9.74 |
9.10 - 9.74 |
1.0588 times |
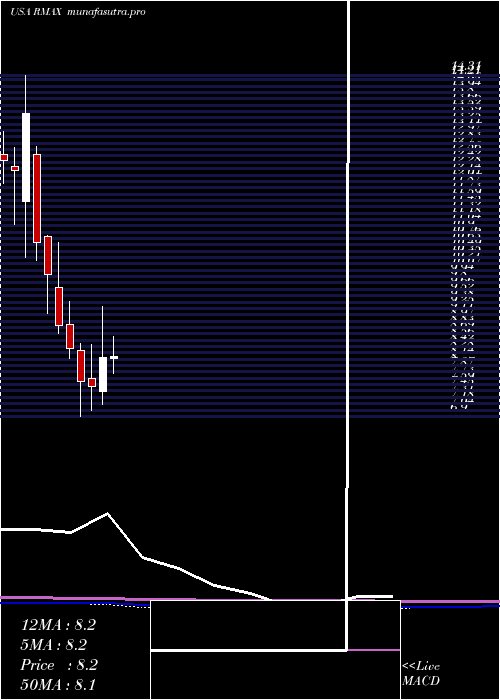
Monthly price and charts ReMax Strong monthly Stock price targets for ReMax RMAX are 7.93 and 8.22 | Monthly Target 1 | 7.88 | | Monthly Target 2 | 7.98 | | Monthly Target 3 | 8.1666666666667 | | Monthly Target 4 | 8.27 | | Monthly Target 5 | 8.46 |
Monthly price and volumes Re Max
| Date |
Closing |
Open |
Range |
Volume |
Thu 04 December 2025 |
8.09 (-1.58%) |
8.11 |
8.06 - 8.35 |
0.1344 times |
Fri 28 November 2025 |
8.22 (3.66%) |
7.90 |
7.25 - 8.45 |
0.9219 times |
Fri 31 October 2025 |
7.93 (-15.91%) |
9.38 |
7.54 - 9.47 |
1.0339 times |
Tue 30 September 2025 |
9.43 (0.11%) |
9.29 |
8.94 - 10.32 |
1.1398 times |
Fri 29 August 2025 |
9.42 (22.5%) |
7.61 |
7.25 - 9.65 |
1.5877 times |
Thu 31 July 2025 |
7.69 (-5.99%) |
8.15 |
7.55 - 8.84 |
1.4392 times |
Mon 30 June 2025 |
8.18 (8.34%) |
7.44 |
7.15 - 9.28 |
1.0948 times |
Fri 30 May 2025 |
7.55 (-1.31%) |
7.72 |
7.02 - 8.46 |
0.9509 times |
Wed 30 April 2025 |
7.65 (-8.6%) |
8.34 |
6.90 - 8.49 |
0.7761 times |
Mon 31 March 2025 |
8.37 (-5.74%) |
8.89 |
8.16 - 9.39 |
0.9211 times |
Fri 28 February 2025 |
8.88 (-11.02%) |
9.71 |
8.69 - 10.67 |
0.6855 times |
DMA SMA EMA moving averages of Re Max RMAX
DMA (daily moving average) of Re Max RMAX
| DMA period | DMA value | | 5 day DMA | 8.19 | | 12 day DMA | 8.01 | | 20 day DMA | 7.85 | | 35 day DMA | 8.04 | | 50 day DMA | 8.3 | | 100 day DMA | 8.61 | | 150 day DMA | 8.39 | | 200 day DMA | 8.35 | EMA (exponential moving average) of Re Max RMAX
| EMA period | EMA current | EMA prev | EMA prev2 | | 5 day EMA | 8.16 | 8.2 | 8.18 | | 12 day EMA | 8.07 | 8.07 | 8.04 | | 20 day EMA | 8.04 | 8.04 | 8.02 | | 35 day EMA | 8.19 | 8.2 | 8.2 | | 50 day EMA | 8.42 | 8.43 | 8.44 |
SMA (simple moving average) of Re Max RMAX
| SMA period | SMA current | SMA prev | SMA prev2 | | 5 day SMA | 8.19 | 8.25 | 8.28 | | 12 day SMA | 8.01 | 7.97 | 7.91 | | 20 day SMA | 7.85 | 7.83 | 7.8 | | 35 day SMA | 8.04 | 8.05 | 8.06 | | 50 day SMA | 8.3 | 8.33 | 8.36 | | 100 day SMA | 8.61 | 8.61 | 8.61 | | 150 day SMA | 8.39 | 8.39 | 8.38 | | 200 day SMA | 8.35 | 8.36 | 8.37 |
|
|
