RegionalManagement RM full analysis,charts,indicators,moving averages,SMA,DMA,EMA,ADX,MACD,RSIRegional Management RM WideScreen charts, DMA,SMA,EMA technical analysis, forecast prediction, by indicators ADX,MACD,RSI,CCI USA stock exchange
operates under Finance sector & deals in Finance Consumer Services
Daily price and charts and targets RegionalManagement Strong Daily Stock price targets for RegionalManagement RM are 40 and 41.48 | Daily Target 1 | 38.85 | | Daily Target 2 | 39.66 | | Daily Target 3 | 40.326666666667 | | Daily Target 4 | 41.14 | | Daily Target 5 | 41.81 |
Daily price and volume Regional Management
| Date |
Closing |
Open |
Range |
Volume |
Tue 21 October 2025 |
40.48 (1.61%) |
40.02 |
39.51 - 40.99 |
1.1906 times |
Mon 20 October 2025 |
39.84 (2.23%) |
39.19 |
39.19 - 39.99 |
0.6306 times |
Fri 17 October 2025 |
38.97 (0.46%) |
38.81 |
38.67 - 39.33 |
1.0874 times |
Thu 16 October 2025 |
38.79 (-2.49%) |
39.85 |
38.62 - 39.85 |
1.1935 times |
Wed 15 October 2025 |
39.78 (-0.87%) |
40.39 |
39.57 - 40.39 |
0.7043 times |
Tue 14 October 2025 |
40.13 (3.32%) |
38.30 |
38.30 - 40.40 |
1.3821 times |
Mon 13 October 2025 |
38.84 (2.35%) |
38.24 |
38.08 - 39.11 |
1.1169 times |
Tue 07 October 2025 |
37.95 (-1.99%) |
38.64 |
37.85 - 38.73 |
1.1316 times |
Mon 06 October 2025 |
38.72 (-0.54%) |
39.06 |
38.64 - 39.52 |
0.5197 times |
Fri 03 October 2025 |
38.93 (0.03%) |
39.14 |
38.73 - 40.27 |
1.0432 times |
Thu 02 October 2025 |
38.92 (0.26%) |
38.62 |
38.53 - 39.44 |
0.653 times |
Weekly price and charts RegionalManagement Strong weekly Stock price targets for RegionalManagement RM are 39.84 and 41.64 | Weekly Target 1 | 38.42 | | Weekly Target 2 | 39.45 | | Weekly Target 3 | 40.22 | | Weekly Target 4 | 41.25 | | Weekly Target 5 | 42.02 |
Weekly price and volumes for Regional Management
| Date |
Closing |
Open |
Range |
Volume |
Tue 21 October 2025 |
40.48 (3.87%) |
39.19 |
39.19 - 40.99 |
0.3602 times |
Fri 17 October 2025 |
38.97 (2.69%) |
38.24 |
38.08 - 40.40 |
1.0846 times |
Tue 07 October 2025 |
37.95 (-2.52%) |
39.06 |
37.85 - 39.52 |
0.3266 times |
Fri 03 October 2025 |
38.93 (-5.81%) |
41.37 |
37.81 - 41.37 |
1.4067 times |
Fri 26 September 2025 |
41.33 (-6.49%) |
43.94 |
41.33 - 45.73 |
1.0147 times |
Fri 19 September 2025 |
44.20 (3.68%) |
42.86 |
42.86 - 46.00 |
1.953 times |
Fri 12 September 2025 |
42.63 (-1.07%) |
43.26 |
41.11 - 43.71 |
0.9815 times |
Fri 05 September 2025 |
43.09 (-1.71%) |
43.28 |
42.18 - 44.71 |
1.1365 times |
Fri 29 August 2025 |
43.84 (0%) |
43.25 |
43.19 - 43.91 |
0.2436 times |
Fri 29 August 2025 |
43.84 (8.17%) |
40.54 |
40.39 - 43.91 |
1.4926 times |
Fri 22 August 2025 |
40.53 (7.74%) |
37.42 |
36.88 - 40.80 |
1.2997 times |
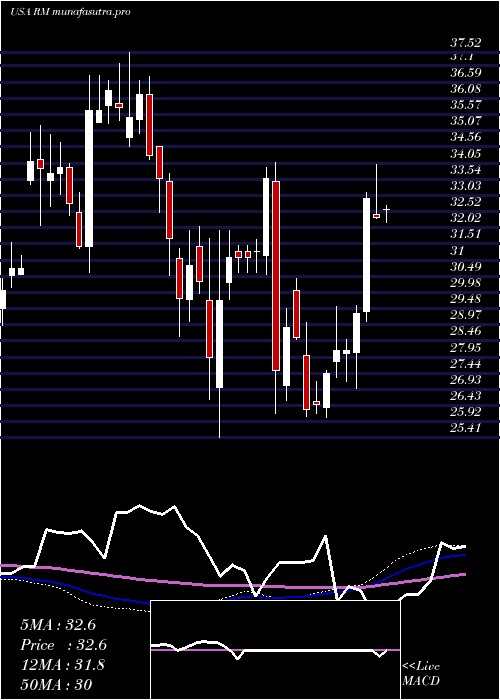
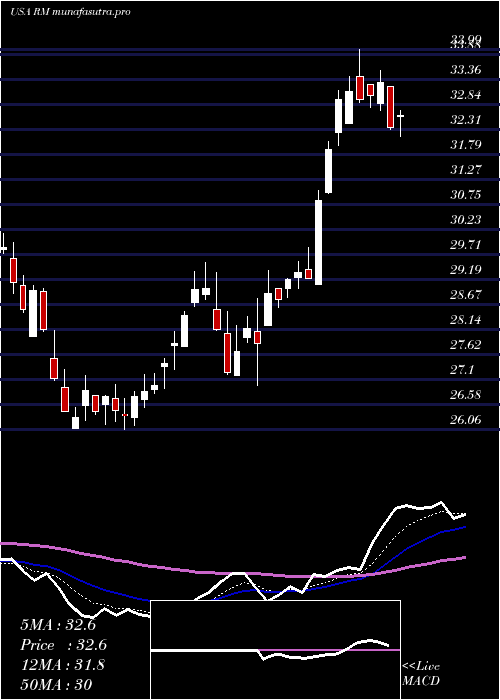
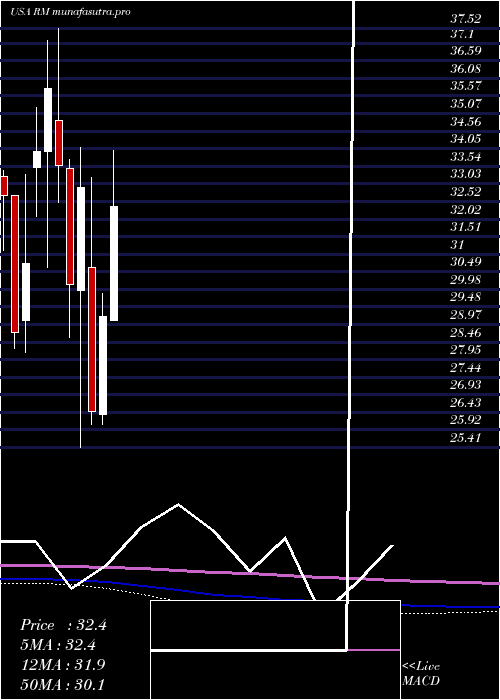
Monthly price and charts RegionalManagement Strong monthly Stock price targets for RegionalManagement RM are 39.16 and 42.32 | Monthly Target 1 | 36.61 | | Monthly Target 2 | 38.54 | | Monthly Target 3 | 39.766666666667 | | Monthly Target 4 | 41.7 | | Monthly Target 5 | 42.93 |
Monthly price and volumes Regional Management
| Date |
Closing |
Open |
Range |
Volume |
Tue 21 October 2025 |
40.48 (3.9%) |
38.35 |
37.83 - 40.99 |
0.4701 times |
Tue 30 September 2025 |
38.96 (-11.13%) |
43.28 |
37.81 - 46.00 |
1.0758 times |
Fri 29 August 2025 |
43.84 (31.89%) |
32.77 |
31.29 - 43.91 |
1.204 times |
Thu 31 July 2025 |
33.24 (13.8%) |
29.08 |
29.08 - 34.87 |
0.9404 times |
Mon 30 June 2025 |
29.21 (10.43%) |
26.36 |
26.06 - 29.86 |
1.0324 times |
Fri 30 May 2025 |
26.45 (-19.68%) |
30.62 |
26.07 - 33.21 |
1.2278 times |
Wed 30 April 2025 |
32.93 (9.37%) |
29.95 |
25.41 - 34.07 |
0.9115 times |
Mon 31 March 2025 |
30.11 (-10.25%) |
33.47 |
28.60 - 33.73 |
0.929 times |
Fri 28 February 2025 |
33.55 (-6.26%) |
34.85 |
32.49 - 37.52 |
0.9235 times |
Fri 31 January 2025 |
35.79 (5.33%) |
33.98 |
30.61 - 37.19 |
1.2856 times |
Tue 31 December 2024 |
33.98 (10.61%) |
33.50 |
32.08 - 35.23 |
0.6692 times |
DMA SMA EMA moving averages of Regional Management RM
DMA (daily moving average) of Regional Management RM
| DMA period | DMA value | | 5 day DMA | 39.57 | | 12 day DMA | 39.18 | | 20 day DMA | 40.37 | | 35 day DMA | 41.68 | | 50 day DMA | 40.82 | | 100 day DMA | 35.55 | | 150 day DMA | 33.72 | | 200 day DMA | 33.86 | EMA (exponential moving average) of Regional Management RM
| EMA period | EMA current | EMA prev | EMA prev2 | | 5 day EMA | 39.74 | 39.37 | 39.14 | | 12 day EMA | 39.78 | 39.65 | 39.61 | | 20 day EMA | 40.13 | 40.09 | 40.12 | | 35 day EMA | 40 | 39.97 | 39.98 | | 50 day EMA | 40.11 | 40.1 | 40.11 |
SMA (simple moving average) of Regional Management RM
| SMA period | SMA current | SMA prev | SMA prev2 | | 5 day SMA | 39.57 | 39.5 | 39.3 | | 12 day SMA | 39.18 | 39.05 | 39.07 | | 20 day SMA | 40.37 | 40.62 | 40.82 | | 35 day SMA | 41.68 | 41.76 | 41.83 | | 50 day SMA | 40.82 | 40.69 | 40.58 | | 100 day SMA | 35.55 | 35.41 | 35.28 | | 150 day SMA | 33.72 | 33.65 | 33.59 | | 200 day SMA | 33.86 | 33.82 | 33.79 |
|
|
