RioTinto RIO full analysis,charts,indicators,moving averages,SMA,DMA,EMA,ADX,MACD,RSIRio Tinto RIO WideScreen charts, DMA,SMA,EMA technical analysis, forecast prediction, by indicators ADX,MACD,RSI,CCI USA stock exchange
operates under Basic Industries sector & deals in Precious Metals
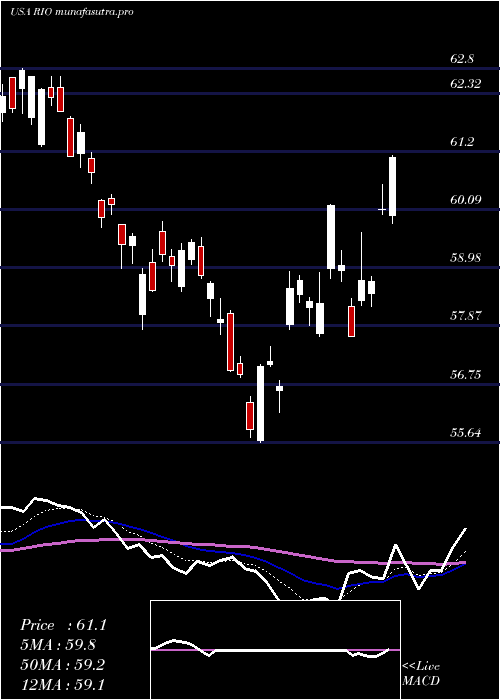
Daily price and charts and targets RioTinto Strong Daily Stock price targets for RioTinto RIO are 68.7 and 69.79 | Daily Target 1 | 67.79 | | Daily Target 2 | 68.51 | | Daily Target 3 | 68.876666666667 | | Daily Target 4 | 69.6 | | Daily Target 5 | 69.97 |
Daily price and volume Rio Tinto
| Date |
Closing |
Open |
Range |
Volume |
Mon 20 October 2025 |
69.24 (1.79%) |
68.28 |
68.15 - 69.24 |
1.1864 times |
Fri 17 October 2025 |
68.02 (-1.06%) |
68.50 |
67.39 - 68.50 |
0.8487 times |
Thu 16 October 2025 |
68.75 (-0.16%) |
69.11 |
68.32 - 69.20 |
0.9492 times |
Wed 15 October 2025 |
68.86 (0.94%) |
68.63 |
68.47 - 69.30 |
1.1562 times |
Tue 14 October 2025 |
68.22 (0.09%) |
66.62 |
66.49 - 68.91 |
1.7503 times |
Mon 13 October 2025 |
68.16 (2.88%) |
67.50 |
66.94 - 68.36 |
1.3583 times |
Tue 07 October 2025 |
66.25 (-1.49%) |
66.89 |
66.24 - 67.02 |
0.9232 times |
Mon 06 October 2025 |
67.25 (1.72%) |
66.26 |
66.06 - 67.41 |
0.5845 times |
Fri 03 October 2025 |
66.11 (-0.23%) |
66.29 |
65.87 - 66.60 |
0.5777 times |
Thu 02 October 2025 |
66.26 (-0.05%) |
66.91 |
65.29 - 66.92 |
0.6654 times |
Wed 01 October 2025 |
66.29 (0.42%) |
66.64 |
65.95 - 67.05 |
0.8932 times |
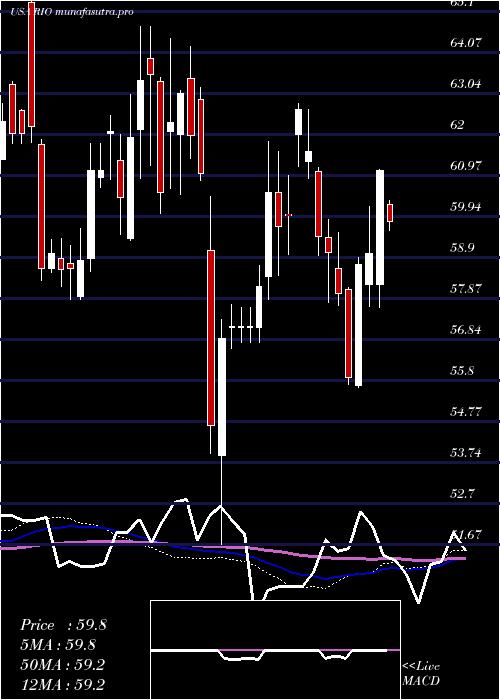
Weekly price and charts RioTinto Strong weekly Stock price targets for RioTinto RIO are 68.7 and 69.79 | Weekly Target 1 | 67.79 | | Weekly Target 2 | 68.51 | | Weekly Target 3 | 68.876666666667 | | Weekly Target 4 | 69.6 | | Weekly Target 5 | 69.97 |
Weekly price and volumes for Rio Tinto
| Date |
Closing |
Open |
Range |
Volume |
Mon 20 October 2025 |
69.24 (1.79%) |
68.28 |
68.15 - 69.24 |
0.3427 times |
Fri 17 October 2025 |
68.02 (2.67%) |
67.50 |
66.49 - 69.30 |
1.751 times |
Tue 07 October 2025 |
66.25 (0.21%) |
66.26 |
66.06 - 67.41 |
0.4355 times |
Fri 03 October 2025 |
66.11 (2.02%) |
65.57 |
65.29 - 67.05 |
1.1557 times |
Fri 26 September 2025 |
64.80 (3.88%) |
63.40 |
63.12 - 66.15 |
1.7268 times |
Fri 19 September 2025 |
62.38 (-0.1%) |
62.64 |
61.72 - 64.03 |
1.4763 times |
Fri 12 September 2025 |
62.44 (-2.39%) |
63.90 |
61.84 - 63.97 |
1.4136 times |
Fri 05 September 2025 |
63.97 (1.99%) |
61.60 |
61.40 - 64.35 |
0.7555 times |
Fri 29 August 2025 |
62.72 (0%) |
62.82 |
62.63 - 63.26 |
0.1683 times |
Fri 29 August 2025 |
62.72 (0.05%) |
62.76 |
61.66 - 63.26 |
0.7747 times |
Fri 22 August 2025 |
62.69 (2.37%) |
60.64 |
60.22 - 62.82 |
1.3898 times |
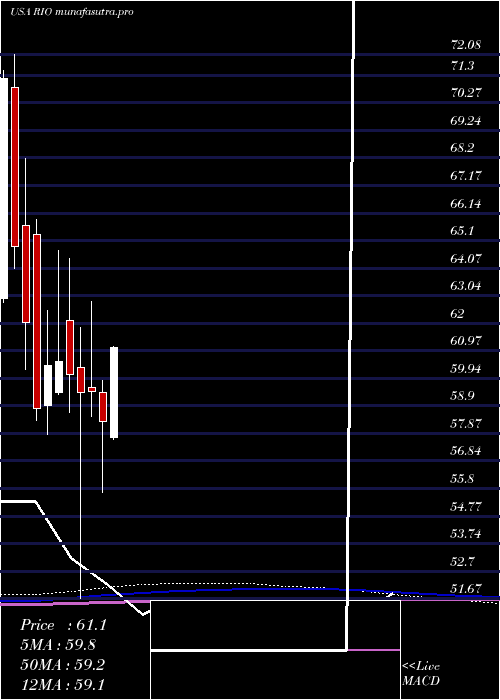
Monthly price and charts RioTinto Strong monthly Stock price targets for RioTinto RIO are 67.27 and 71.28 | Monthly Target 1 | 63.93 | | Monthly Target 2 | 66.59 | | Monthly Target 3 | 67.943333333333 | | Monthly Target 4 | 70.6 | | Monthly Target 5 | 71.95 |
Monthly price and volumes Rio Tinto
| Date |
Closing |
Open |
Range |
Volume |
Mon 20 October 2025 |
69.24 (4.89%) |
66.64 |
65.29 - 69.30 |
0.5749 times |
Tue 30 September 2025 |
66.01 (5.25%) |
61.60 |
61.40 - 66.33 |
1.0801 times |
Fri 29 August 2025 |
62.72 (4.94%) |
59.80 |
59.35 - 63.84 |
0.8702 times |
Thu 31 July 2025 |
59.77 (2.47%) |
57.71 |
57.66 - 64.76 |
1.4387 times |
Mon 30 June 2025 |
58.33 (-1.85%) |
59.41 |
55.64 - 59.86 |
0.9413 times |
Fri 30 May 2025 |
59.43 (0.05%) |
59.60 |
58.49 - 62.80 |
0.962 times |
Wed 30 April 2025 |
59.40 (-1.13%) |
60.36 |
51.67 - 61.84 |
1.0833 times |
Mon 31 March 2025 |
60.08 (-0.79%) |
62.09 |
58.67 - 64.43 |
0.9568 times |
Fri 28 February 2025 |
60.56 (0.25%) |
59.39 |
59.34 - 64.74 |
0.8282 times |
Fri 31 January 2025 |
60.41 (2.72%) |
58.91 |
57.85 - 62.49 |
1.2646 times |
Tue 31 December 2024 |
58.81 (-5.19%) |
65.34 |
58.34 - 65.91 |
0.7095 times |
DMA SMA EMA moving averages of Rio Tinto RIO
DMA (daily moving average) of Rio Tinto RIO
| DMA period | DMA value | | 5 day DMA | 68.62 | | 12 day DMA | 67.45 | | 20 day DMA | 66.05 | | 35 day DMA | 64.66 | | 50 day DMA | 63.8 | | 100 day DMA | 61.73 | | 150 day DMA | 61.1 | | 200 day DMA | 61.11 | EMA (exponential moving average) of Rio Tinto RIO
| EMA period | EMA current | EMA prev | EMA prev2 | | 5 day EMA | 68.49 | 68.11 | 68.16 | | 12 day EMA | 67.48 | 67.16 | 67 | | 20 day EMA | 66.5 | 66.21 | 66.02 | | 35 day EMA | 65.18 | 64.94 | 64.76 | | 50 day EMA | 63.95 | 63.73 | 63.56 |
SMA (simple moving average) of Rio Tinto RIO
| SMA period | SMA current | SMA prev | SMA prev2 | | 5 day SMA | 68.62 | 68.4 | 68.05 | | 12 day SMA | 67.45 | 67.18 | 66.91 | | 20 day SMA | 66.05 | 65.74 | 65.51 | | 35 day SMA | 64.66 | 64.45 | 64.28 | | 50 day SMA | 63.8 | 63.62 | 63.45 | | 100 day SMA | 61.73 | 61.65 | 61.6 | | 150 day SMA | 61.1 | 61.05 | 61.01 | | 200 day SMA | 61.11 | 61.06 | 61.02 |
|
|
