Transocean RIG full analysis,charts,indicators,moving averages,SMA,DMA,EMA,ADX,MACD,RSITransocean RIG WideScreen charts, DMA,SMA,EMA technical analysis, forecast prediction, by indicators ADX,MACD,RSI,CCI USA stock exchange
operates under Energy sector & deals in Oil Gas Production
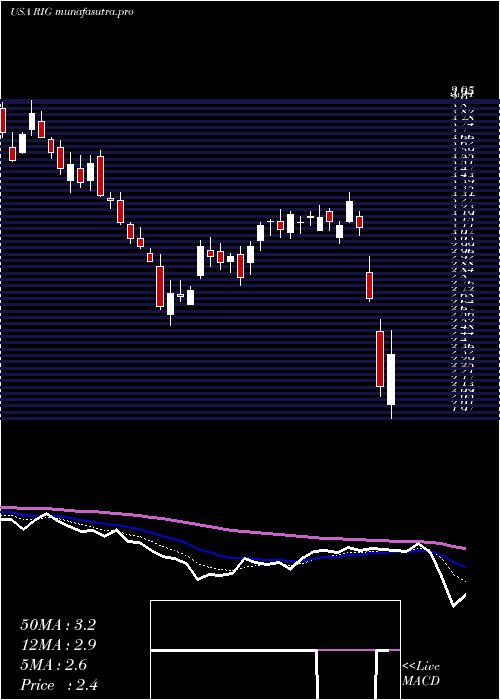
Daily price and charts and targets Transocean Strong Daily Stock price targets for Transocean RIG are 4.35 and 4.47 | Daily Target 1 | 4.32 | | Daily Target 2 | 4.37 | | Daily Target 3 | 4.4366666666667 | | Daily Target 4 | 4.49 | | Daily Target 5 | 4.56 |
Daily price and volume Transocean
| Date |
Closing |
Open |
Range |
Volume |
Thu 04 December 2025 |
4.43 (-0.45%) |
4.46 |
4.38 - 4.50 |
0.673 times |
Wed 03 December 2025 |
4.45 (3.25%) |
4.38 |
4.35 - 4.50 |
1.0228 times |
Tue 02 December 2025 |
4.31 (-0.92%) |
4.33 |
4.22 - 4.40 |
0.784 times |
Mon 01 December 2025 |
4.35 (-1.36%) |
4.38 |
4.34 - 4.49 |
1.0608 times |
Fri 28 November 2025 |
4.41 (2.56%) |
4.33 |
4.24 - 4.43 |
0.6226 times |
Wed 26 November 2025 |
4.30 (6.17%) |
4.15 |
4.03 - 4.36 |
1.0633 times |
Tue 25 November 2025 |
4.05 (0.75%) |
4.01 |
3.90 - 4.10 |
1.0459 times |
Mon 24 November 2025 |
4.02 (3.34%) |
3.93 |
3.88 - 4.07 |
0.9938 times |
Fri 21 November 2025 |
3.89 (1.3%) |
3.80 |
3.68 - 3.92 |
1.2709 times |
Thu 20 November 2025 |
3.84 (-6.34%) |
4.15 |
3.82 - 4.22 |
1.4629 times |
Wed 19 November 2025 |
4.10 (-0.73%) |
4.02 |
3.98 - 4.14 |
0.9388 times |
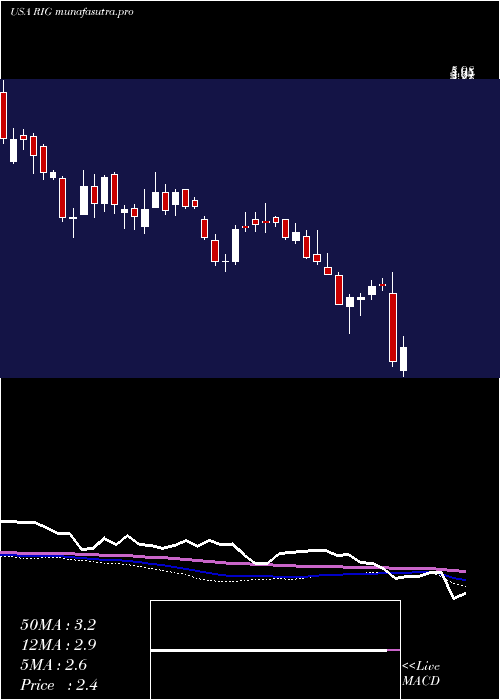
Weekly price and charts Transocean Strong weekly Stock price targets for Transocean RIG are 4.33 and 4.61 | Weekly Target 1 | 4.1 | | Weekly Target 2 | 4.27 | | Weekly Target 3 | 4.3833333333333 | | Weekly Target 4 | 4.55 | | Weekly Target 5 | 4.66 |
Weekly price and volumes for Transocean
| Date |
Closing |
Open |
Range |
Volume |
Thu 04 December 2025 |
4.43 (0.45%) |
4.38 |
4.22 - 4.50 |
0.5687 times |
Fri 28 November 2025 |
4.41 (13.37%) |
3.93 |
3.88 - 4.43 |
0.5984 times |
Fri 21 November 2025 |
3.89 (-2.99%) |
4.02 |
3.68 - 4.23 |
1.0355 times |
Fri 14 November 2025 |
4.01 (0.75%) |
4.04 |
3.96 - 4.39 |
1.1139 times |
Fri 07 November 2025 |
3.98 (3.65%) |
3.86 |
3.75 - 3.99 |
0.7694 times |
Fri 31 October 2025 |
3.84 (0%) |
3.92 |
3.83 - 3.96 |
0.3602 times |
Fri 31 October 2025 |
3.84 (-1.54%) |
3.92 |
3.72 - 4.00 |
1.5637 times |
Fri 24 October 2025 |
3.90 (19.63%) |
3.19 |
3.19 - 4.07 |
1.9811 times |
Fri 17 October 2025 |
3.26 (-5.78%) |
3.17 |
3.08 - 3.39 |
1.491 times |
Tue 07 October 2025 |
3.46 (2.67%) |
3.41 |
3.36 - 3.52 |
0.5182 times |
Fri 03 October 2025 |
3.37 (5.64%) |
3.16 |
3.03 - 3.45 |
1.2798 times |
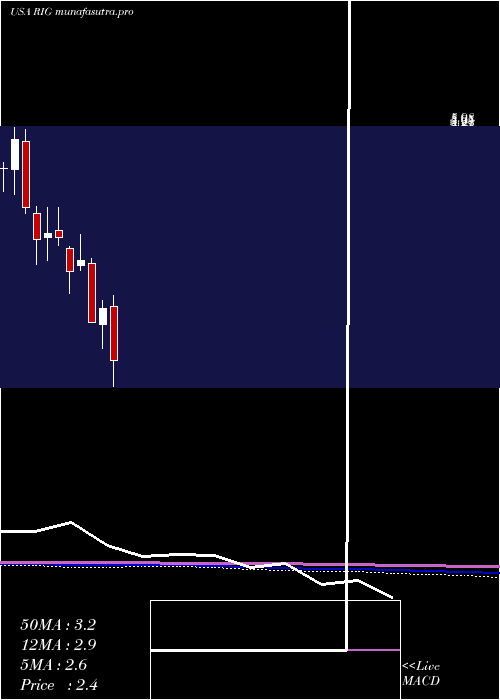
Monthly price and charts Transocean Strong monthly Stock price targets for Transocean RIG are 4.33 and 4.61 | Monthly Target 1 | 4.1 | | Monthly Target 2 | 4.27 | | Monthly Target 3 | 4.3833333333333 | | Monthly Target 4 | 4.55 | | Monthly Target 5 | 4.66 |
Monthly price and volumes Transocean
| Date |
Closing |
Open |
Range |
Volume |
Thu 04 December 2025 |
4.43 (0.45%) |
4.38 |
4.22 - 4.50 |
0.1458 times |
Fri 28 November 2025 |
4.41 (14.84%) |
3.86 |
3.68 - 4.43 |
0.9019 times |
Fri 31 October 2025 |
3.84 (23.08%) |
3.14 |
3.08 - 4.07 |
1.6925 times |
Tue 30 September 2025 |
3.12 (2.97%) |
3.01 |
2.93 - 3.81 |
1.187 times |
Fri 29 August 2025 |
3.03 (3.77%) |
2.85 |
2.72 - 3.21 |
0.6293 times |
Thu 31 July 2025 |
2.92 (12.74%) |
2.56 |
2.51 - 3.14 |
0.9269 times |
Mon 30 June 2025 |
2.59 (4.02%) |
2.55 |
2.47 - 3.37 |
1.2125 times |
Fri 30 May 2025 |
2.49 (16.9%) |
2.16 |
2.15 - 2.88 |
1.0464 times |
Wed 30 April 2025 |
2.13 (-32.81%) |
3.20 |
1.97 - 3.38 |
1.3005 times |
Mon 31 March 2025 |
3.17 (7.46%) |
2.92 |
2.55 - 3.30 |
0.9573 times |
Fri 28 February 2025 |
2.95 (-24.74%) |
3.87 |
2.95 - 3.95 |
0.8026 times |
DMA SMA EMA moving averages of Transocean RIG
DMA (daily moving average) of Transocean RIG
| DMA period | DMA value | | 5 day DMA | 4.39 | | 12 day DMA | 4.19 | | 20 day DMA | 4.14 | | 35 day DMA | 3.94 | | 50 day DMA | 3.75 | | 100 day DMA | 3.38 | | 150 day DMA | 3.14 | | 200 day DMA | 3.06 | EMA (exponential moving average) of Transocean RIG
| EMA period | EMA current | EMA prev | EMA prev2 | | 5 day EMA | 4.37 | 4.34 | 4.28 | | 12 day EMA | 4.24 | 4.21 | 4.17 | | 20 day EMA | 4.14 | 4.11 | 4.07 | | 35 day EMA | 3.96 | 3.93 | 3.9 | | 50 day EMA | 3.79 | 3.76 | 3.73 |
SMA (simple moving average) of Transocean RIG
| SMA period | SMA current | SMA prev | SMA prev2 | | 5 day SMA | 4.39 | 4.36 | 4.28 | | 12 day SMA | 4.19 | 4.16 | 4.12 | | 20 day SMA | 4.14 | 4.12 | 4.09 | | 35 day SMA | 3.94 | 3.91 | 3.87 | | 50 day SMA | 3.75 | 3.73 | 3.71 | | 100 day SMA | 3.38 | 3.37 | 3.35 | | 150 day SMA | 3.14 | 3.13 | 3.12 | | 200 day SMA | 3.06 | 3.05 | 3.05 |
|
|
